

Control of Crystallization Pathways by Electric Fields
159
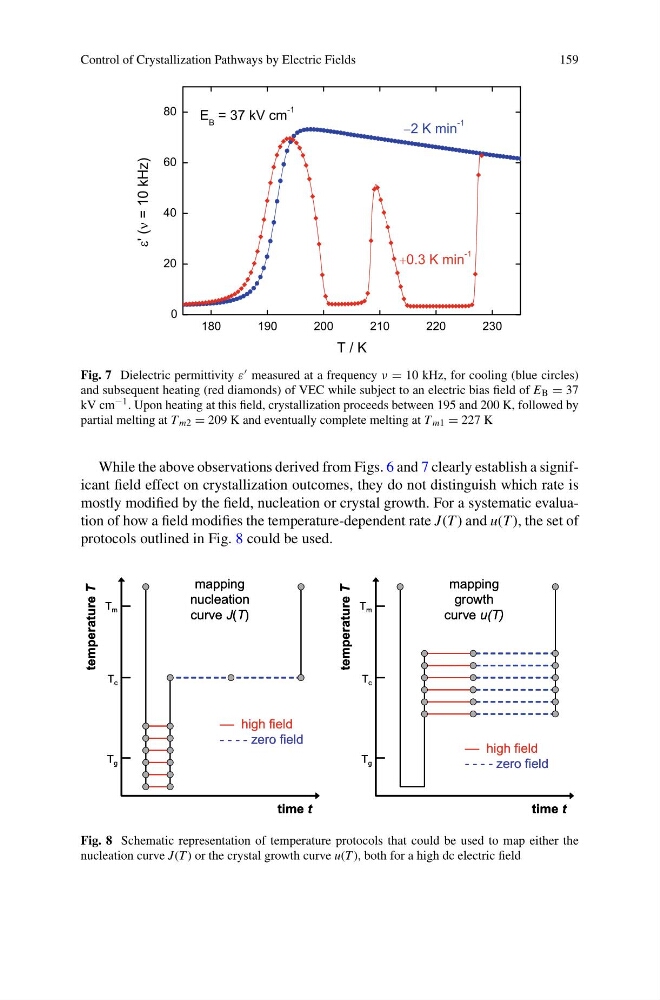
Fig. 7 Dielectric permittivity ε measured at a frequency ν = 10 kHz, for cooling (blue circles)
and subsequent heating (red diamonds) of VEC while subject to an electric bias field of E B = 37
kV cm −1 . Upon heating at this field, crystallization proceeds between 195 and 200 K, followed by
partial melting at T m2 = 209 K and eventually complete melting at T m1 = 227 K
While the above observations derived from Figs. 6 and 7 clearly establish a significant field effect on crystallization outcomes, they do not distinguish which rate is
mostly modified by the field, nucleation or crystal growth. For a systematic evaluation of how a field modifies the temperature-dependent rate J(T ) and u(T ), the set of
protocols outlined in Fig. 8 could be used.
mapping
nucleation
curve J(T)
mapping
growth
curve u(T)
T g
T c
T m
temperature
T
time t
—— high field
- - - - zero field
T g
T c
T m
temperature
T
time t
—— high field
- - - - zero field
mapping
nucleation
curve J(T)
mapping
growth
curve u(T)
T g
T c
T m
temperature
T
time t
—— high field
- - - - zero field
T g
T c
T m
temperature
T
time t
—— high field
- - - - zero field
Fig. 8 Schematic representation of temperature protocols that could be used to map either the
nucleation curve J(T ) or the crystal growth curve u(T ), both for a high dc electric field
159
Fig. 7 Dielectric permittivity ε measured at a frequency ν = 10 kHz, for cooling (blue circles)
and subsequent heating (red diamonds) of VEC while subject to an electric bias field of E B = 37
kV cm −1 . Upon heating at this field, crystallization proceeds between 195 and 200 K, followed by
partial melting at T m2 = 209 K and eventually complete melting at T m1 = 227 K
While the above observations derived from Figs. 6 and 7 clearly establish a significant field effect on crystallization outcomes, they do not distinguish which rate is
mostly modified by the field, nucleation or crystal growth. For a systematic evaluation of how a field modifies the temperature-dependent rate J(T ) and u(T ), the set of
protocols outlined in Fig. 8 could be used.
mapping
nucleation
curve J(T)
mapping
growth
curve u(T)
T g
T c
T m
temperature
T
time t
—— high field
- - - - zero field
T g
T c
T m
temperature
T
time t
—— high field
- - - - zero field
mapping
nucleation
curve J(T)
mapping
growth
curve u(T)
T g
T c
T m
temperature
T
time t
—— high field
- - - - zero field
T g
T c
T m
temperature
T
time t
—— high field
- - - - zero field
Fig. 8 Schematic representation of temperature protocols that could be used to map either the
nucleation curve J(T ) or the crystal growth curve u(T ), both for a high dc electric field