

Control of Crystallization Pathways by Electric Fields
157
T g
T c
T m
temperature
T
time t
——high field
----zero field
T g
T c
T m
temperature
T
time t
——high field
----zero field
T g
T c
T m
temperature
T
time t
——high field
----zero field
a
b
c
d
T g
T c
T m
temperature
T
time t
——high field
----zero field
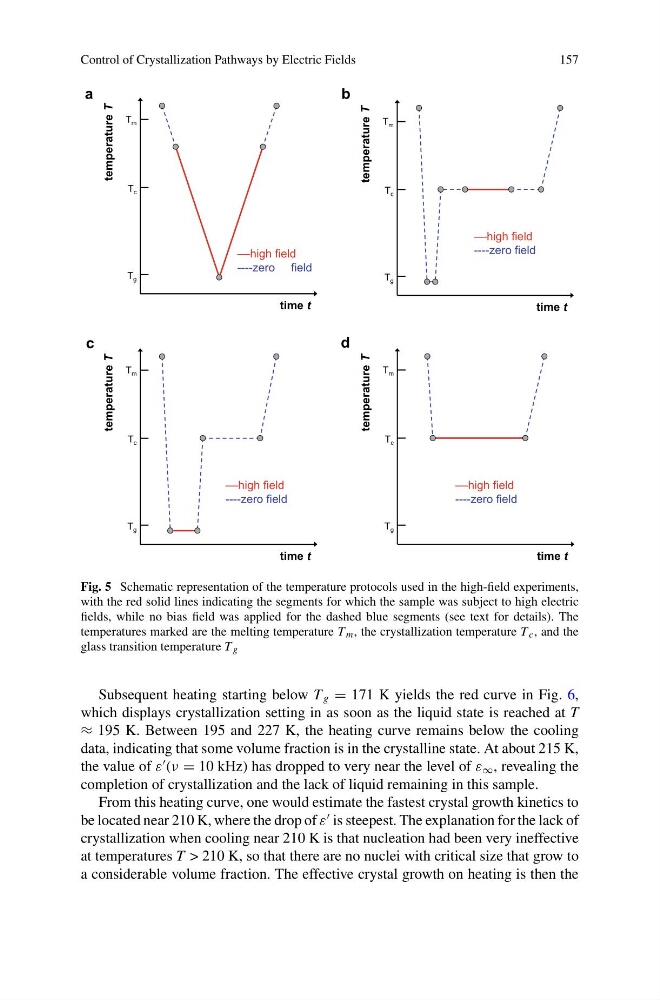
Fig. 5 Schematic representation of the temperature protocols used in the high-field experiments,
with the red solid lines indicating the segments for which the sample was subject to high electric
fields, while no bias field was applied for the dashed blue segments (see text for details). The
temperatures marked are the melting temperature T m , the crystallization temperature T c , and the
glass transition temperature T g
Subsequent heating starting below T g = 171 K yields the red curve in Fig. 6,
which displays crystallization setting in as soon as the liquid state is reached at T
≈ 195 K. Between 195 and 227 K, the heating curve remains below the cooling
data, indicating that some volume fraction is in the crystalline state. At about 215 K,
the value of ε
(ν = 10 kHz) has dropped to very near the level of ε ∞ , revealing the
completion of crystallization and the lack of liquid remaining in this sample.
From this heating curve, one would estimate the fastest crystal growth kinetics to
be located near 210 K, where the drop of ε
is steepest. The explanation for the lack of
crystallization when cooling near 210 K is that nucleation had been very ineffective
at temperatures T > 210 K, so that there are no nuclei with critical size that grow to
a considerable volume fraction. The effective crystal growth on heating is then the
157
T g
T c
T m
temperature
T
time t
——high field
----zero field
T g
T c
T m
temperature
T
time t
——high field
----zero field
T g
T c
T m
temperature
T
time t
——high field
----zero field
a
b
c
d
T g
T c
T m
temperature
T
time t
——high field
----zero field
Fig. 5 Schematic representation of the temperature protocols used in the high-field experiments,
with the red solid lines indicating the segments for which the sample was subject to high electric
fields, while no bias field was applied for the dashed blue segments (see text for details). The
temperatures marked are the melting temperature T m , the crystallization temperature T c , and the
glass transition temperature T g
Subsequent heating starting below T g = 171 K yields the red curve in Fig. 6,
which displays crystallization setting in as soon as the liquid state is reached at T
≈ 195 K. Between 195 and 227 K, the heating curve remains below the cooling
data, indicating that some volume fraction is in the crystalline state. At about 215 K,
the value of ε
(ν = 10 kHz) has dropped to very near the level of ε ∞ , revealing the
completion of crystallization and the lack of liquid remaining in this sample.
From this heating curve, one would estimate the fastest crystal growth kinetics to
be located near 210 K, where the drop of ε
is steepest. The explanation for the lack of
crystallization when cooling near 210 K is that nucleation had been very ineffective
at temperatures T > 210 K, so that there are no nuclei with critical size that grow to
a considerable volume fraction. The effective crystal growth on heating is then the