

Isothermal and Non-isothermal Crystallization in Liquid Crystals …
141
and crystallization characteristic time τ cr derived by POM investigations agree with
the values determined by thermogram analysis.
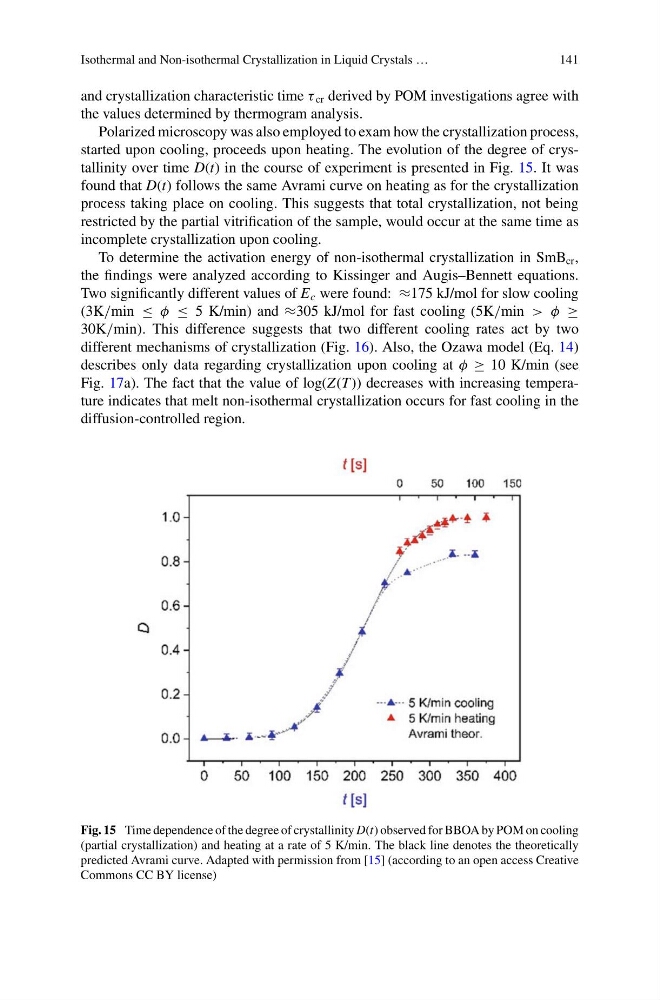
Polarized microscopy was also employed to exam how the crystallization process,
started upon cooling, proceeds upon heating. The evolution of the degree of crystallinity over time D(t) in the course of experiment is presented in Fig. 15. It was
found that D(t) follows the same Avrami curve on heating as for the crystallization
process taking place on cooling. This suggests that total crystallization, not being
restricted by the partial vitrification of the sample, would occur at the same time as
incomplete crystallization upon cooling.
To determine the activation energy of non-isothermal crystallization in SmB cr ,
the findings were analyzed according to Kissinger and Augis–Bennett equations.
Two significantly different values of E c were found: ≈175 kJ/mol for slow cooling
(3K/min ≤ φ ≤ 5 K/min) and ≈305 kJ/mol for fast cooling (5K/min > φ ≥
30K/min). This difference suggests that two different cooling rates act by two
different mechanisms of crystallization (Fig. 16). Also, the Ozawa model (Eq. 14)
describes only data regarding crystallization upon cooling at φ ≥ 10 K/min (see
Fig. 17a). The fact that the value of log(Z(T )) decreases with increasing temperature indicates that melt non-isothermal crystallization occurs for fast cooling in the
diffusion-controlled region.
Fig. 15 Time dependence of the degree of crystallinity D(t) observed for BBOA by POM on cooling
(partial crystallization) and heating at a rate of 5 K/min. The black line denotes the theoretically
predicted Avrami curve. Adapted with permission from [15] (according to an open access Creative
Commons CC BY license)
141
and crystallization characteristic time τ cr derived by POM investigations agree with
the values determined by thermogram analysis.
Polarized microscopy was also employed to exam how the crystallization process,
started upon cooling, proceeds upon heating. The evolution of the degree of crystallinity over time D(t) in the course of experiment is presented in Fig. 15. It was
found that D(t) follows the same Avrami curve on heating as for the crystallization
process taking place on cooling. This suggests that total crystallization, not being
restricted by the partial vitrification of the sample, would occur at the same time as
incomplete crystallization upon cooling.
To determine the activation energy of non-isothermal crystallization in SmB cr ,
the findings were analyzed according to Kissinger and Augis–Bennett equations.
Two significantly different values of E c were found: ≈175 kJ/mol for slow cooling
(3K/min ≤ φ ≤ 5 K/min) and ≈305 kJ/mol for fast cooling (5K/min > φ ≥
30K/min). This difference suggests that two different cooling rates act by two
different mechanisms of crystallization (Fig. 16). Also, the Ozawa model (Eq. 14)
describes only data regarding crystallization upon cooling at φ ≥ 10 K/min (see
Fig. 17a). The fact that the value of log(Z(T )) decreases with increasing temperature indicates that melt non-isothermal crystallization occurs for fast cooling in the
diffusion-controlled region.
Fig. 15 Time dependence of the degree of crystallinity D(t) observed for BBOA by POM on cooling
(partial crystallization) and heating at a rate of 5 K/min. The black line denotes the theoretically
predicted Avrami curve. Adapted with permission from [15] (according to an open access Creative
Commons CC BY license)