

140
M. Jasiurkowska-Delaporte
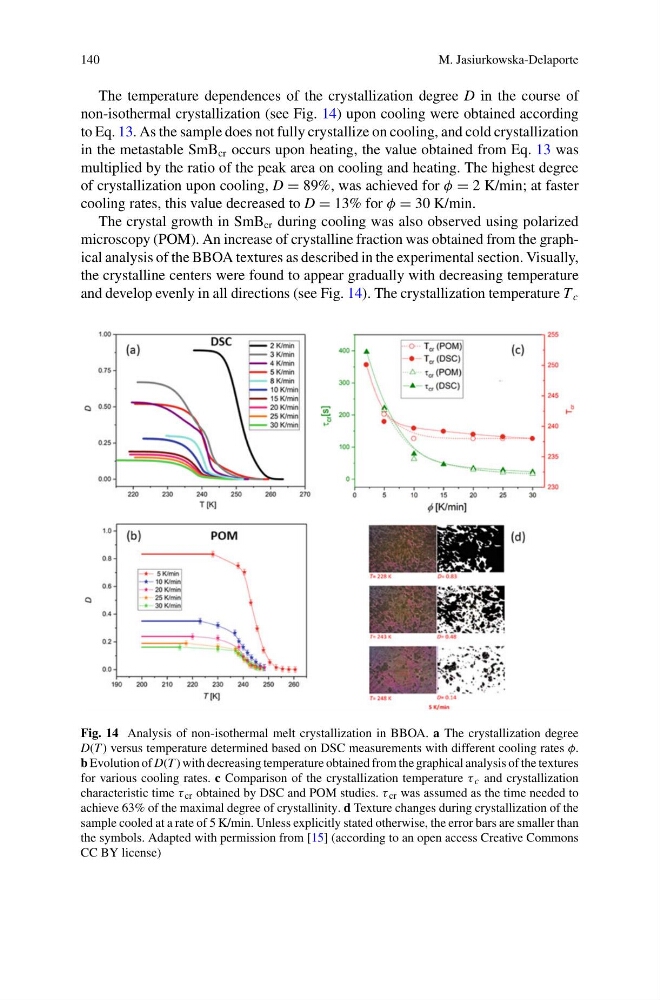
The temperature dependences of the crystallization degree D in the course of
non-isothermal crystallization (see Fig. 14) upon cooling were obtained according
to Eq. 13. As the sample does not fully crystallize on cooling, and cold crystallization
in the metastable SmB cr occurs upon heating, the value obtained from Eq. 13 was
multiplied by the ratio of the peak area on cooling and heating. The highest degree
of crystallization upon cooling, D = 89%, was achieved for φ = 2 K/min; at faster
cooling rates, this value decreased to D = 13% for φ = 30 K/min.
The crystal growth in SmB cr during cooling was also observed using polarized
microscopy (POM). An increase of crystalline fraction was obtained from the graphical analysis of the BBOA textures as described in the experimental section. Visually,
the crystalline centers were found to appear gradually with decreasing temperature
and develop evenly in all directions (see Fig. 14). The crystallization temperature T c
Fig. 14 Analysis of non-isothermal melt crystallization in BBOA. a The crystallization degree
D(T ) versus temperature determined based on DSC measurements with different cooling rates φ.
b Evolution of D(T ) with decreasing temperature obtained from the graphical analysis of the textures
for various cooling rates. c Comparison of the crystallization temperature τ c and crystallization
characteristic time τ cr obtained by DSC and POM studies. τ cr was assumed as the time needed to
achieve 63% of the maximal degree of crystallinity. d Texture changes during crystallization of the
sample cooled at a rate of 5 K/min. Unless explicitly stated otherwise, the error bars are smaller than
the symbols. Adapted with permission from [15] (according to an open access Creative Commons
CC BY license)
M. Jasiurkowska-Delaporte
The temperature dependences of the crystallization degree D in the course of
non-isothermal crystallization (see Fig. 14) upon cooling were obtained according
to Eq. 13. As the sample does not fully crystallize on cooling, and cold crystallization
in the metastable SmB cr occurs upon heating, the value obtained from Eq. 13 was
multiplied by the ratio of the peak area on cooling and heating. The highest degree
of crystallization upon cooling, D = 89%, was achieved for φ = 2 K/min; at faster
cooling rates, this value decreased to D = 13% for φ = 30 K/min.
The crystal growth in SmB cr during cooling was also observed using polarized
microscopy (POM). An increase of crystalline fraction was obtained from the graphical analysis of the BBOA textures as described in the experimental section. Visually,
the crystalline centers were found to appear gradually with decreasing temperature
and develop evenly in all directions (see Fig. 14). The crystallization temperature T c
Fig. 14 Analysis of non-isothermal melt crystallization in BBOA. a The crystallization degree
D(T ) versus temperature determined based on DSC measurements with different cooling rates φ.
b Evolution of D(T ) with decreasing temperature obtained from the graphical analysis of the textures
for various cooling rates. c Comparison of the crystallization temperature τ c and crystallization
characteristic time τ cr obtained by DSC and POM studies. τ cr was assumed as the time needed to
achieve 63% of the maximal degree of crystallinity. d Texture changes during crystallization of the
sample cooled at a rate of 5 K/min. Unless explicitly stated otherwise, the error bars are smaller than
the symbols. Adapted with permission from [15] (according to an open access Creative Commons
CC BY license)