

Isothermal and Non-isothermal Crystallization in Liquid Crystals …
131
The melt crystallization was examined by directly cooling the material at a rate of
10 K/min from the isotropic state at 385 K to a selected temperature. In the case of
cold crystallization, the sample was first quenched below T g and then heated to the
selected measurement temperature. The changes of the dielectric spectra occurring
over time during melt and cold crystallization at 271 K are shown in Fig. 6(c–f).
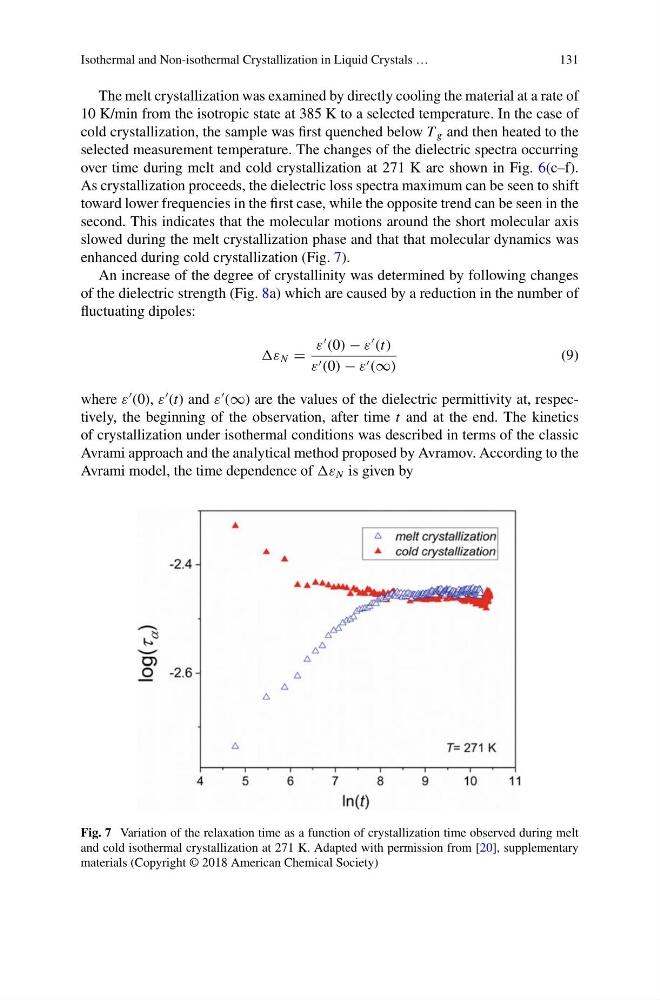
As crystallization proceeds, the dielectric loss spectra maximum can be seen to shift
toward lower frequencies in the first case, while the opposite trend can be seen in the
second. This indicates that the molecular motions around the short molecular axis
slowed during the melt crystallization phase and that that molecular dynamics was
enhanced during cold crystallization (Fig. 7).
An increase of the degree of crystallinity was determined by following changes
of the dielectric strength (Fig. 8a) which are caused by a reduction in the number of
fluctuating dipoles:
ε N =
ε
(0) − ε
(t)
ε (0) − ε (∞)
(9)
where ε
(0), ε
(t) and ε
(∞) are the values of the dielectric permittivity at, respectively, the beginning of the observation, after time t and at the end. The kinetics
of crystallization under isothermal conditions was described in terms of the classic
Avrami approach and the analytical method proposed by Avramov. According to the
Avrami model, the time dependence of ε N is given by
Fig. 7 Variation of the relaxation time as a function of crystallization time observed during melt
and cold isothermal crystallization at 271 K. Adapted with permission from [20], supplementary
materials (Copyright © 2018 American Chemical Society)
131
The melt crystallization was examined by directly cooling the material at a rate of
10 K/min from the isotropic state at 385 K to a selected temperature. In the case of
cold crystallization, the sample was first quenched below T g and then heated to the
selected measurement temperature. The changes of the dielectric spectra occurring
over time during melt and cold crystallization at 271 K are shown in Fig. 6(c–f).
As crystallization proceeds, the dielectric loss spectra maximum can be seen to shift
toward lower frequencies in the first case, while the opposite trend can be seen in the
second. This indicates that the molecular motions around the short molecular axis
slowed during the melt crystallization phase and that that molecular dynamics was
enhanced during cold crystallization (Fig. 7).
An increase of the degree of crystallinity was determined by following changes
of the dielectric strength (Fig. 8a) which are caused by a reduction in the number of
fluctuating dipoles:
ε N =
ε
(0) − ε
(t)
ε (0) − ε (∞)
(9)
where ε
(0), ε
(t) and ε
(∞) are the values of the dielectric permittivity at, respectively, the beginning of the observation, after time t and at the end. The kinetics
of crystallization under isothermal conditions was described in terms of the classic
Avrami approach and the analytical method proposed by Avramov. According to the
Avrami model, the time dependence of ε N is given by
Fig. 7 Variation of the relaxation time as a function of crystallization time observed during melt
and cold isothermal crystallization at 271 K. Adapted with permission from [20], supplementary
materials (Copyright © 2018 American Chemical Society)