

Isothermal and Non-isothermal Crystallization in Liquid Crystals …
127
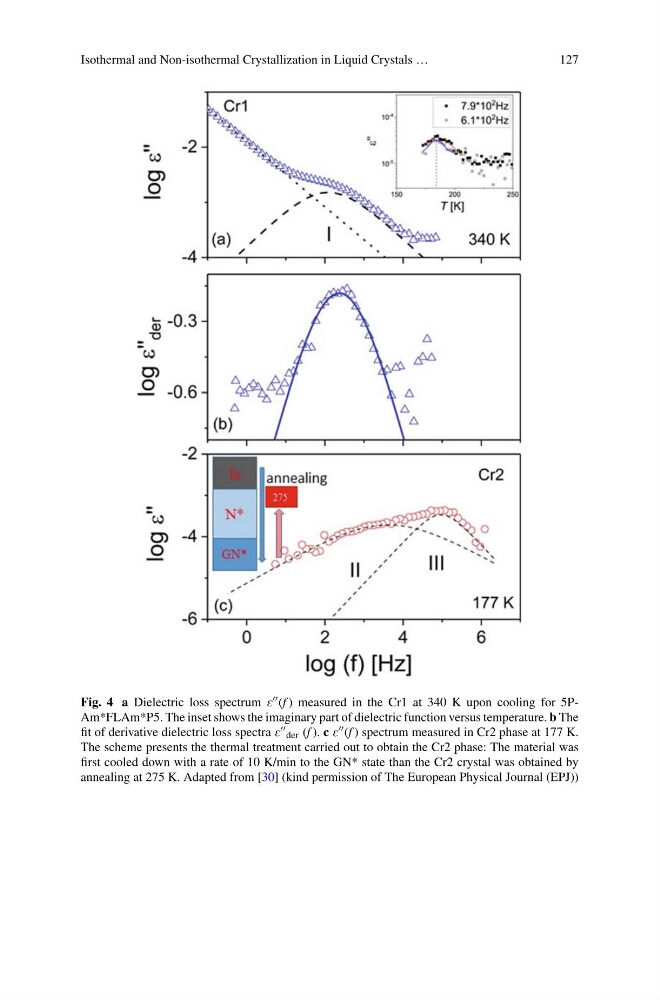
Fig. 4 a Dielectric loss spectrum E (f ) measured in the Cr1 at 340 K upon cooling for 5PAm*FLAm*P5. The inset shows the imaginary part of dielectric function versus temperature. b The
fit of derivative dielectric loss spectra E der (f ). c E (f ) spectrum measured in Cr2 phase at 177 K.
The scheme presents the thermal treatment carried out to obtain the Cr2 phase: The material was
first cooled down with a rate of 10 K/min to the GN* state than the Cr2 crystal was obtained by
annealing at 275 K. Adapted from [30] (kind permission of The European Physical Journal (EPJ))
127
Fig. 4 a Dielectric loss spectrum E (f ) measured in the Cr1 at 340 K upon cooling for 5PAm*FLAm*P5. The inset shows the imaginary part of dielectric function versus temperature. b The
fit of derivative dielectric loss spectra E der (f ). c E (f ) spectrum measured in Cr2 phase at 177 K.
The scheme presents the thermal treatment carried out to obtain the Cr2 phase: The material was
first cooled down with a rate of 10 K/min to the GN* state than the Cr2 crystal was obtained by
annealing at 275 K. Adapted from [30] (kind permission of The European Physical Journal (EPJ))