

126
M. Jasiurkowska-Delaporte
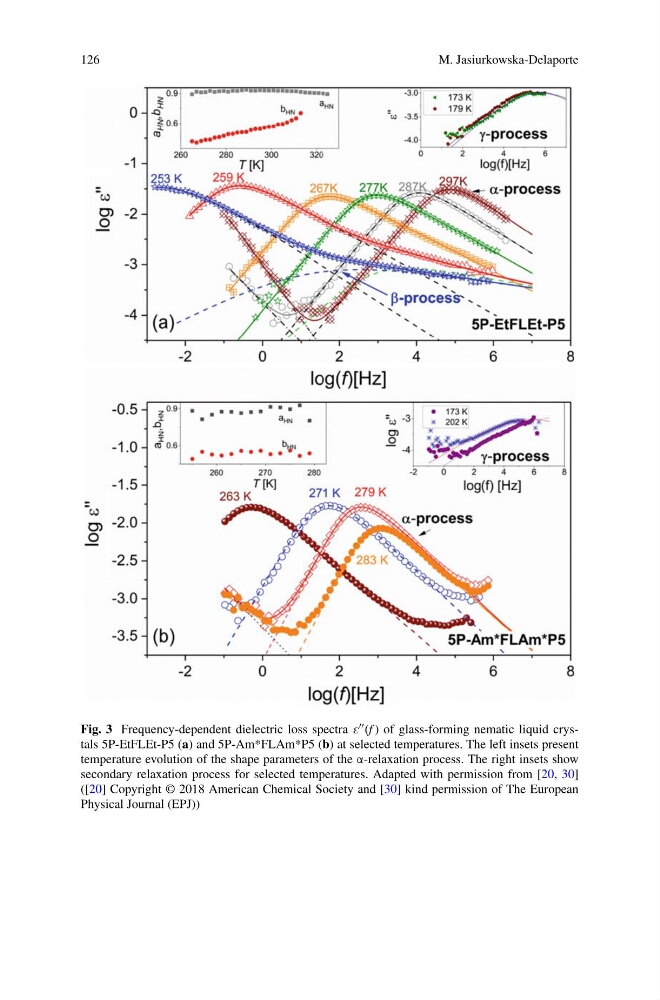
Fig. 3 Frequency-dependent dielectric loss spectra E (f ) of glass-forming nematic liquid crystals 5P-EtFLEt-P5 (a) and 5P-Am*FLAm*P5 (b) at selected temperatures. The left insets present
temperature evolution of the shape parameters of the α-relaxation process. The right insets show
secondary relaxation process for selected temperatures. Adapted with permission from [20, 30]
([20] Copyright © 2018 American Chemical Society and [30] kind permission of The European
Physical Journal (EPJ))
M. Jasiurkowska-Delaporte
Fig. 3 Frequency-dependent dielectric loss spectra E (f ) of glass-forming nematic liquid crystals 5P-EtFLEt-P5 (a) and 5P-Am*FLAm*P5 (b) at selected temperatures. The left insets present
temperature evolution of the shape parameters of the α-relaxation process. The right insets show
secondary relaxation process for selected temperatures. Adapted with permission from [20, 30]
([20] Copyright © 2018 American Chemical Society and [30] kind permission of The European
Physical Journal (EPJ))