

Ordering Transitions in Short-Chain Alcohols
107
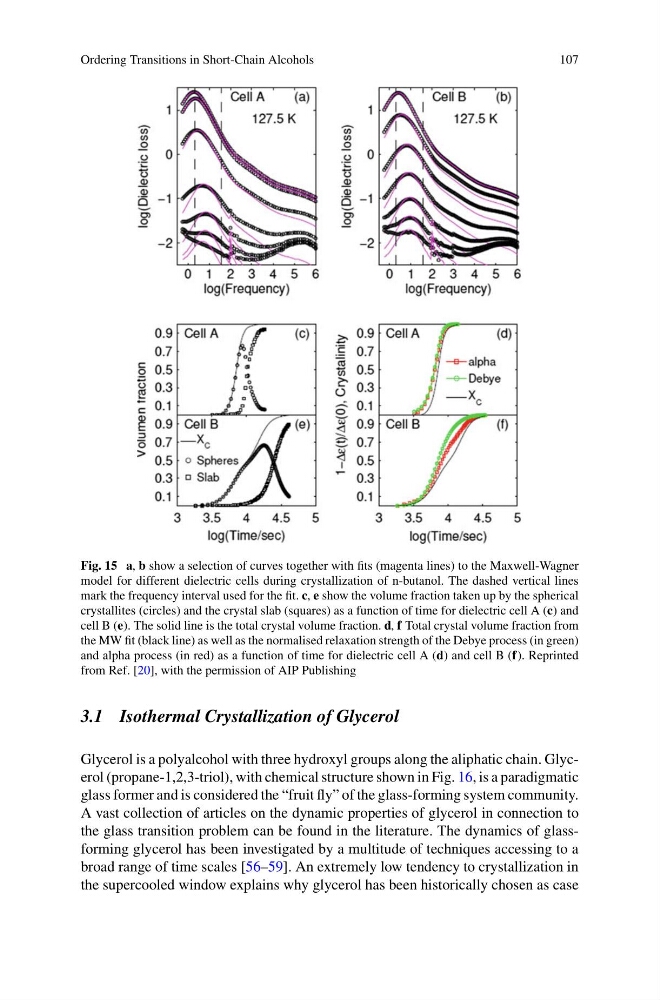
Fig. 15 a, b show a selection of curves together with fits (magenta lines) to the Maxwell-Wagner
model for different dielectric cells during crystallization of n-butanol. The dashed vertical lines
mark the frequency interval used for the fit. c, e show the volume fraction taken up by the spherical
crystallites (circles) and the crystal slab (squares) as a function of time for dielectric cell A (c) and
cell B (e). The solid line is the total crystal volume fraction. d, f Total crystal volume fraction from
the MW fit (black line) as well as the normalised relaxation strength of the Debye process (in green)
and alpha process (in red) as a function of time for dielectric cell A (d) and cell B (f). Reprinted
from Ref. [20], with the permission of AIP Publishing
3.1 Isothermal Crystallization of Glycerol
Glycerol is a polyalcohol with three hydroxyl groups along the aliphatic chain. Glycerol (propane-1,2,3-triol), with chemical structure shown in Fig. 16, is a paradigmatic
glass former and is considered the “fruit fly” of the glass-forming system community.
A vast collection of articles on the dynamic properties of glycerol in connection to
the glass transition problem can be found in the literature. The dynamics of glassforming glycerol has been investigated by a multitude of techniques accessing to a
broad range of time scales [56–59]. An extremely low tendency to crystallization in
the supercooled window explains why glycerol has been historically chosen as case
107
Fig. 15 a, b show a selection of curves together with fits (magenta lines) to the Maxwell-Wagner
model for different dielectric cells during crystallization of n-butanol. The dashed vertical lines
mark the frequency interval used for the fit. c, e show the volume fraction taken up by the spherical
crystallites (circles) and the crystal slab (squares) as a function of time for dielectric cell A (c) and
cell B (e). The solid line is the total crystal volume fraction. d, f Total crystal volume fraction from
the MW fit (black line) as well as the normalised relaxation strength of the Debye process (in green)
and alpha process (in red) as a function of time for dielectric cell A (d) and cell B (f). Reprinted
from Ref. [20], with the permission of AIP Publishing
3.1 Isothermal Crystallization of Glycerol
Glycerol is a polyalcohol with three hydroxyl groups along the aliphatic chain. Glycerol (propane-1,2,3-triol), with chemical structure shown in Fig. 16, is a paradigmatic
glass former and is considered the “fruit fly” of the glass-forming system community.
A vast collection of articles on the dynamic properties of glycerol in connection to
the glass transition problem can be found in the literature. The dynamics of glassforming glycerol has been investigated by a multitude of techniques accessing to a
broad range of time scales [56–59]. An extremely low tendency to crystallization in
the supercooled window explains why glycerol has been historically chosen as case