

98
A. Sanz
0.0
0.2
0.4
0.6
0.8
1.0
2.5
3.0
3.5
4.0
4.5
5.0
5.5
6.0
0.5
1.0
1.5
2.0
2.5
3.0
3.5
4.0
log(f
max
)
II
X Crystal
139 K
134 K
log(f
max
)
I
(b)
(a)
(d)
(c)
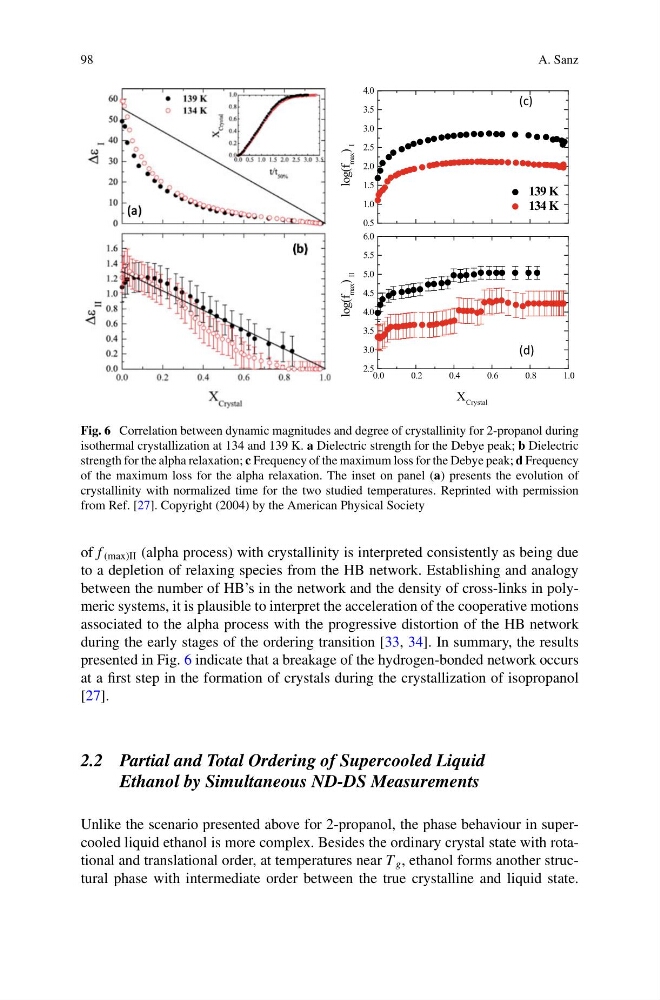
Fig. 6 Correlation between dynamic magnitudes and degree of crystallinity for 2-propanol during
isothermal crystallization at 134 and 139 K. a Dielectric strength for the Debye peak; b Dielectric
strength for the alpha relaxation; c Frequency of the maximum loss for the Debye peak; d Frequency
of the maximum loss for the alpha relaxation. The inset on panel (a) presents the evolution of
crystallinity with normalized time for the two studied temperatures. Reprinted with permission
from Ref. [27]. Copyright (2004) by the American Physical Society
of f (max)II (alpha process) with crystallinity is interpreted consistently as being due
to a depletion of relaxing species from the HB network. Establishing and analogy
between the number of HB’s in the network and the density of cross-links in polymeric systems, it is plausible to interpret the acceleration of the cooperative motions
associated to the alpha process with the progressive distortion of the HB network
during the early stages of the ordering transition [33, 34]. In summary, the results
presented in Fig. 6 indicate that a breakage of the hydrogen-bonded network occurs
at a first step in the formation of crystals during the crystallization of isopropanol
[27].
2.2 Partial and Total Ordering of Supercooled Liquid
Ethanol by Simultaneous ND-DS Measurements
Unlike the scenario presented above for 2-propanol, the phase behaviour in supercooled liquid ethanol is more complex. Besides the ordinary crystal state with rotational and translational order, at temperatures near T g , ethanol forms another structural phase with intermediate order between the true crystalline and liquid state.
A. Sanz
0.0
0.2
0.4
0.6
0.8
1.0
2.5
3.0
3.5
4.0
4.5
5.0
5.5
6.0
0.5
1.0
1.5
2.0
2.5
3.0
3.5
4.0
log(f
max
)
II
X Crystal
139 K
134 K
log(f
max
)
I
(b)
(a)
(d)
(c)
Fig. 6 Correlation between dynamic magnitudes and degree of crystallinity for 2-propanol during
isothermal crystallization at 134 and 139 K. a Dielectric strength for the Debye peak; b Dielectric
strength for the alpha relaxation; c Frequency of the maximum loss for the Debye peak; d Frequency
of the maximum loss for the alpha relaxation. The inset on panel (a) presents the evolution of
crystallinity with normalized time for the two studied temperatures. Reprinted with permission
from Ref. [27]. Copyright (2004) by the American Physical Society
of f (max)II (alpha process) with crystallinity is interpreted consistently as being due
to a depletion of relaxing species from the HB network. Establishing and analogy
between the number of HB’s in the network and the density of cross-links in polymeric systems, it is plausible to interpret the acceleration of the cooperative motions
associated to the alpha process with the progressive distortion of the HB network
during the early stages of the ordering transition [33, 34]. In summary, the results
presented in Fig. 6 indicate that a breakage of the hydrogen-bonded network occurs
at a first step in the formation of crystals during the crystallization of isopropanol
[27].
2.2 Partial and Total Ordering of Supercooled Liquid
Ethanol by Simultaneous ND-DS Measurements
Unlike the scenario presented above for 2-propanol, the phase behaviour in supercooled liquid ethanol is more complex. Besides the ordinary crystal state with rotational and translational order, at temperatures near T g , ethanol forms another structural phase with intermediate order between the true crystalline and liquid state.