

Ordering Transitions in Short-Chain Alcohols
97
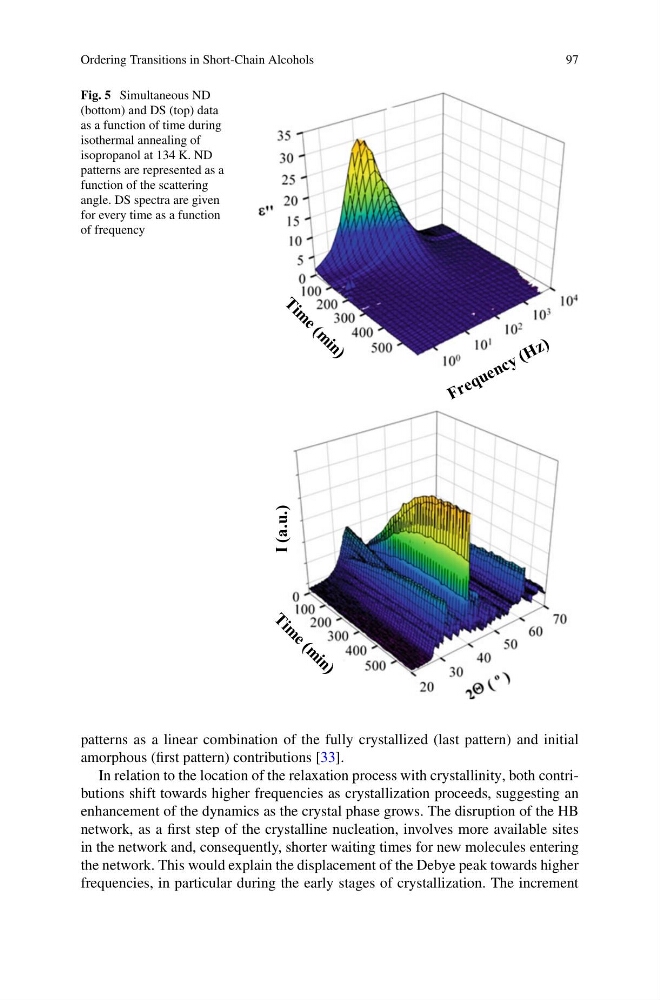
Fig. 5 Simultaneous ND
(bottom) and DS (top) data
as a function of time during
isothermal annealing of
isopropanol at 134 K. ND
patterns are represented as a
function of the scattering
angle. DS spectra are given
for every time as a function
of frequency
I (a.u.)
patterns as a linear combination of the fully crystallized (last pattern) and initial
amorphous (first pattern) contributions [33].
In relation to the location of the relaxation process with crystallinity, both contributions shift towards higher frequencies as crystallization proceeds, suggesting an
enhancement of the dynamics as the crystal phase grows. The disruption of the HB
network, as a first step of the crystalline nucleation, involves more available sites
in the network and, consequently, shorter waiting times for new molecules entering
the network. This would explain the displacement of the Debye peak towards higher
frequencies, in particular during the early stages of crystallization. The increment
97
Fig. 5 Simultaneous ND
(bottom) and DS (top) data
as a function of time during
isothermal annealing of
isopropanol at 134 K. ND
patterns are represented as a
function of the scattering
angle. DS spectra are given
for every time as a function
of frequency
I (a.u.)
patterns as a linear combination of the fully crystallized (last pattern) and initial
amorphous (first pattern) contributions [33].
In relation to the location of the relaxation process with crystallinity, both contributions shift towards higher frequencies as crystallization proceeds, suggesting an
enhancement of the dynamics as the crystal phase grows. The disruption of the HB
network, as a first step of the crystalline nucleation, involves more available sites
in the network and, consequently, shorter waiting times for new molecules entering
the network. This would explain the displacement of the Debye peak towards higher
frequencies, in particular during the early stages of crystallization. The increment