

466
5 Laser Specklometer, Speckle-Optical Diagnostics and Laser …
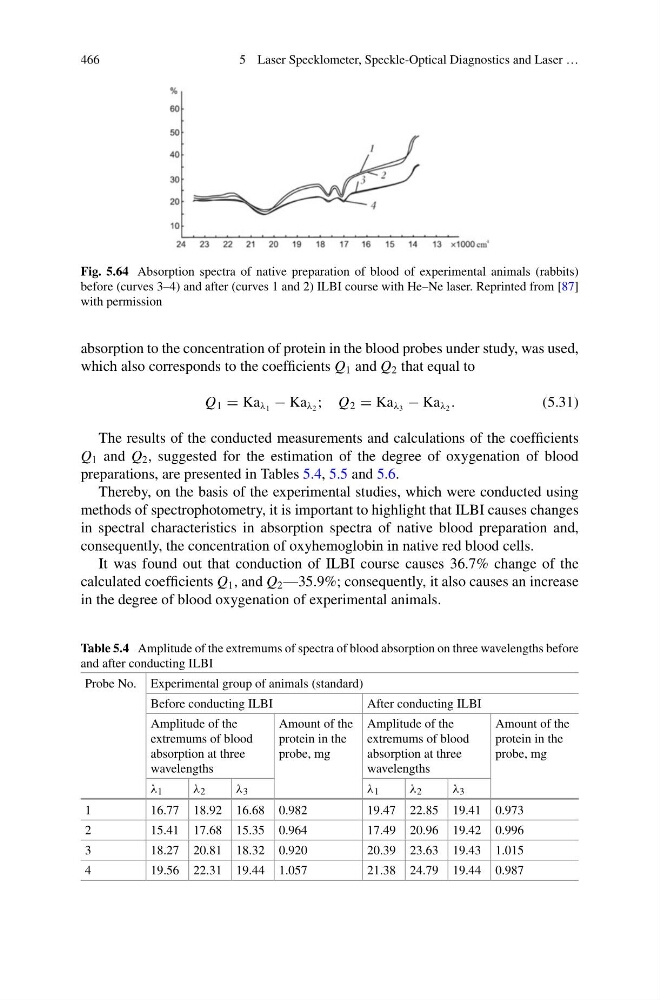
Fig. 5.64 Absorption spectra of native preparation of blood of experimental animals (rabbits)
before (curves 3–4) and after (curves 1 and 2) ILBI course with He–Ne laser. Reprinted from [87]
with permission
absorption to the concentration of protein in the blood probes under study, was used,
which also corresponds to the coefficients Q 1 and Q 2 that equal to
Q 1 = Ka λ 1 − Ka λ 2 ; Q 2 = Ka λ 3 − Ka λ 2 .
(5.31)
The results of the conducted measurements and calculations of the coefficients
Q 1 and Q 2 , suggested for the estimation of the degree of oxygenation of blood
preparations, are presented in Tables 5.4, 5.5 and 5.6.
Thereby, on the basis of the experimental studies, which were conducted using
methods of spectrophotometry, it is important to highlight that ILBI causes changes
in spectral characteristics in absorption spectra of native blood preparation and,
consequently, the concentration of oxyhemoglobin in native red blood cells.
It was found out that conduction of ILBI course causes 36.7% change of the
calculated coefficients Q 1 , and Q 2 —35.9%; consequently, it also causes an increase
in the degree of blood oxygenation of experimental animals.
Table 5.4 Amplitude of the extremums of spectra of blood absorption on three wavelengths before
and after conducting ILBI
Probe No. Experimental group of animals (standard)
Before conducting ILBI
After conducting ILBI
Amplitude of the
extremums of blood
absorption at three
wavelengths
Amount of the
protein in the
probe, mg
Amplitude of the
extremums of blood
absorption at three
wavelengths
Amount of the
protein in the
probe, mg
λ 1
λ 2
λ 3
λ 1
λ 2
λ 3
1
16.77 18.92 16.68 0.982
19.47 22.85 19.41 0.973
2
15.41 17.68 15.35 0.964
17.49 20.96 19.42 0.996
3
18.27 20.81 18.32 0.920
20.39 23.63 19.43 1.015
4
19.56 22.31 19.44 1.057
21.38 24.79 19.44 0.987
5 Laser Specklometer, Speckle-Optical Diagnostics and Laser …
Fig. 5.64 Absorption spectra of native preparation of blood of experimental animals (rabbits)
before (curves 3–4) and after (curves 1 and 2) ILBI course with He–Ne laser. Reprinted from [87]
with permission
absorption to the concentration of protein in the blood probes under study, was used,
which also corresponds to the coefficients Q 1 and Q 2 that equal to
Q 1 = Ka λ 1 − Ka λ 2 ; Q 2 = Ka λ 3 − Ka λ 2 .
(5.31)
The results of the conducted measurements and calculations of the coefficients
Q 1 and Q 2 , suggested for the estimation of the degree of oxygenation of blood
preparations, are presented in Tables 5.4, 5.5 and 5.6.
Thereby, on the basis of the experimental studies, which were conducted using
methods of spectrophotometry, it is important to highlight that ILBI causes changes
in spectral characteristics in absorption spectra of native blood preparation and,
consequently, the concentration of oxyhemoglobin in native red blood cells.
It was found out that conduction of ILBI course causes 36.7% change of the
calculated coefficients Q 1 , and Q 2 —35.9%; consequently, it also causes an increase
in the degree of blood oxygenation of experimental animals.
Table 5.4 Amplitude of the extremums of spectra of blood absorption on three wavelengths before
and after conducting ILBI
Probe No. Experimental group of animals (standard)
Before conducting ILBI
After conducting ILBI
Amplitude of the
extremums of blood
absorption at three
wavelengths
Amount of the
protein in the
probe, mg
Amplitude of the
extremums of blood
absorption at three
wavelengths
Amount of the
protein in the
probe, mg
λ 1
λ 2
λ 3
λ 1
λ 2
λ 3
1
16.77 18.92 16.68 0.982
19.47 22.85 19.41 0.973
2
15.41 17.68 15.35 0.964
17.49 20.96 19.42 0.996
3
18.27 20.81 18.32 0.920
20.39 23.63 19.43 1.015
4
19.56 22.31 19.44 1.057
21.38 24.79 19.44 0.987