

5.13 Analysis of Spectral Characteristics of Radiation Scattered by …
461
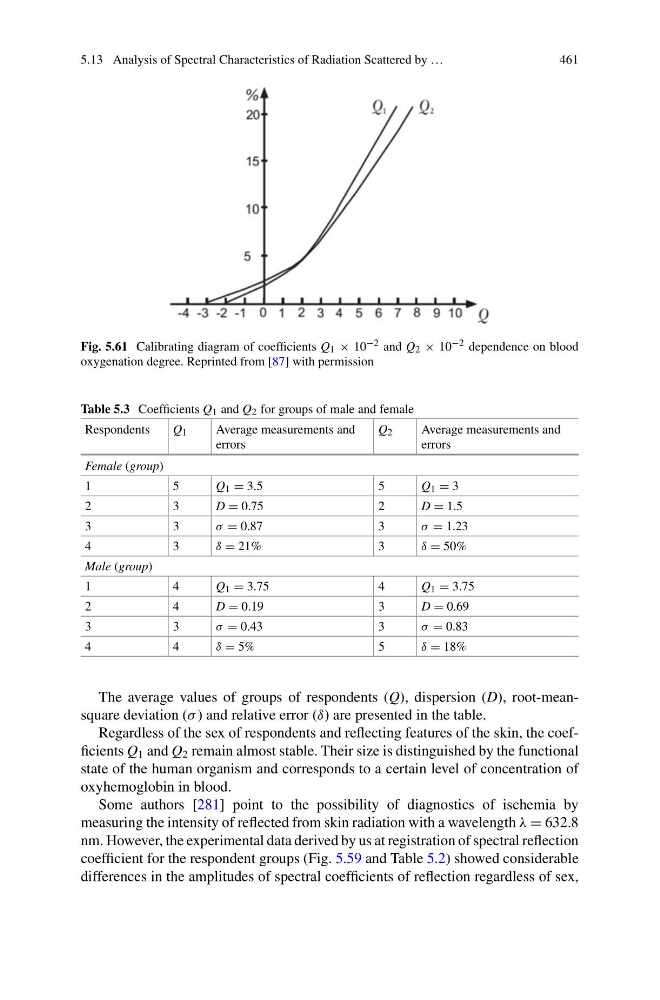
Fig. 5.61 Calibrating diagram of coefficients Q 1 × 10 −2 and Q 2 × 10 −2 dependence on blood
oxygenation degree. Reprinted from [87] with permission
Table 5.3 Coefficients Q 1 and Q 2 for groups of male and female
Respondents
Q 1
Average measurements and
errors
Q 2
Average measurements and
errors
Female (group)
1
5
Q 1 = 3.5
5
Q 1 = 3
2
3
D = 0.75
2
D = 1.5
3
3
σ = 0.87
3
σ = 1.23
4
3
δ = 21%
3
δ = 50%
Male (group)
1
4
Q 1 = 3.75
4
Q 1 = 3.75
2
4
D = 0.19
3
D = 0.69
3
3
σ = 0.43
3
σ = 0.83
4
4
δ = 5%
5
δ = 18%
The average values of groups of respondents (Q), dispersion (D), root-meansquare deviation (σ ) and relative error (δ) are presented in the table.
Regardless of the sex of respondents and reflecting features of the skin, the coefficients Q 1 and Q 2 remain almost stable. Their size is distinguished by the functional
state of the human organism and corresponds to a certain level of concentration of
oxyhemoglobin in blood.
Some authors [281] point to the possibility of diagnostics of ischemia by
measuring the intensity of reflected from skin radiation with a wavelength λ = 632.8
nm. However, the experimental data derived by us at registration of spectral reflection
coefficient for the respondent groups (Fig. 5.59 and Table 5.2) showed considerable
differences in the amplitudes of spectral coefficients of reflection regardless of sex,
461
Fig. 5.61 Calibrating diagram of coefficients Q 1 × 10 −2 and Q 2 × 10 −2 dependence on blood
oxygenation degree. Reprinted from [87] with permission
Table 5.3 Coefficients Q 1 and Q 2 for groups of male and female
Respondents
Q 1
Average measurements and
errors
Q 2
Average measurements and
errors
Female (group)
1
5
Q 1 = 3.5
5
Q 1 = 3
2
3
D = 0.75
2
D = 1.5
3
3
σ = 0.87
3
σ = 1.23
4
3
δ = 21%
3
δ = 50%
Male (group)
1
4
Q 1 = 3.75
4
Q 1 = 3.75
2
4
D = 0.19
3
D = 0.69
3
3
σ = 0.43
3
σ = 0.83
4
4
δ = 5%
5
δ = 18%
The average values of groups of respondents (Q), dispersion (D), root-meansquare deviation (σ ) and relative error (δ) are presented in the table.
Regardless of the sex of respondents and reflecting features of the skin, the coefficients Q 1 and Q 2 remain almost stable. Their size is distinguished by the functional
state of the human organism and corresponds to a certain level of concentration of
oxyhemoglobin in blood.
Some authors [281] point to the possibility of diagnostics of ischemia by
measuring the intensity of reflected from skin radiation with a wavelength λ = 632.8
nm. However, the experimental data derived by us at registration of spectral reflection
coefficient for the respondent groups (Fig. 5.59 and Table 5.2) showed considerable
differences in the amplitudes of spectral coefficients of reflection regardless of sex,