

420
5 Laser Specklometer, Speckle-Optical Diagnostics and Laser …
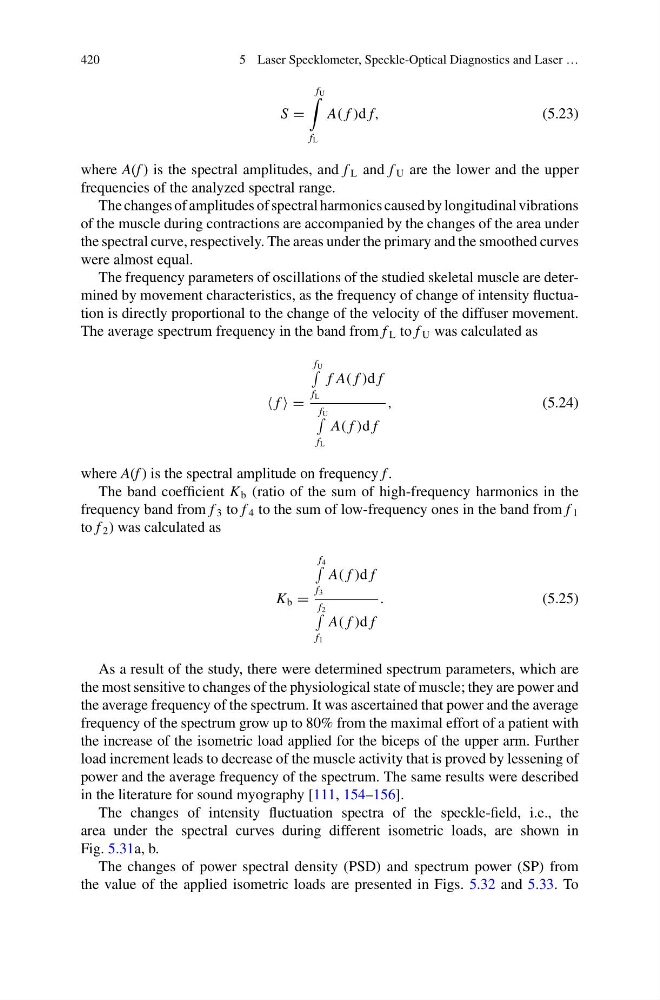
S =
f U
f L
A( f )d f,
(5.23)
where A(f ) is the spectral amplitudes, and f L and f U are the lower and the upper
frequencies of the analyzed spectral range.
The changes of amplitudes of spectral harmonics caused by longitudinal vibrations
of the muscle during contractions are accompanied by the changes of the area under
the spectral curve, respectively. The areas under the primary and the smoothed curves
were almost equal.
The frequency parameters of oscillations of the studied skeletal muscle are determined by movement characteristics, as the frequency of change of intensity fluctuation is directly proportional to the change of the velocity of the diffuser movement.
The average spectrum frequency in the band from f L to f U was calculated as
f =
f U
f L
f A( f )d f
f U
f L
A( f )d f
,
(5.24)
where A(f ) is the spectral amplitude on frequency f .
The band coefficient K b (ratio of the sum of high-frequency harmonics in the
frequency band from f 3 to f 4 to the sum of low-frequency ones in the band from f 1
to f 2 ) was calculated as
K b =
f 4
f 3
A( f )d f
f 2
f 1
A( f )d f
.
(5.25)
As a result of the study, there were determined spectrum parameters, which are
the most sensitive to changes of the physiological state of muscle; they are power and
the average frequency of the spectrum. It was ascertained that power and the average
frequency of the spectrum grow up to 80% from the maximal effort of a patient with
the increase of the isometric load applied for the biceps of the upper arm. Further
load increment leads to decrease of the muscle activity that is proved by lessening of
power and the average frequency of the spectrum. The same results were described
in the literature for sound myography [111, 154–156].
The changes of intensity fluctuation spectra of the speckle-field, i.e., the
area under the spectral curves during different isometric loads, are shown in
Fig. 5.31a, b.
The changes of power spectral density (PSD) and spectrum power (SP) from
the value of the applied isometric loads are presented in Figs. 5.32 and 5.33. To
5 Laser Specklometer, Speckle-Optical Diagnostics and Laser …
S =
f U
f L
A( f )d f,
(5.23)
where A(f ) is the spectral amplitudes, and f L and f U are the lower and the upper
frequencies of the analyzed spectral range.
The changes of amplitudes of spectral harmonics caused by longitudinal vibrations
of the muscle during contractions are accompanied by the changes of the area under
the spectral curve, respectively. The areas under the primary and the smoothed curves
were almost equal.
The frequency parameters of oscillations of the studied skeletal muscle are determined by movement characteristics, as the frequency of change of intensity fluctuation is directly proportional to the change of the velocity of the diffuser movement.
The average spectrum frequency in the band from f L to f U was calculated as
f =
f U
f L
f A( f )d f
f U
f L
A( f )d f
,
(5.24)
where A(f ) is the spectral amplitude on frequency f .
The band coefficient K b (ratio of the sum of high-frequency harmonics in the
frequency band from f 3 to f 4 to the sum of low-frequency ones in the band from f 1
to f 2 ) was calculated as
K b =
f 4
f 3
A( f )d f
f 2
f 1
A( f )d f
.
(5.25)
As a result of the study, there were determined spectrum parameters, which are
the most sensitive to changes of the physiological state of muscle; they are power and
the average frequency of the spectrum. It was ascertained that power and the average
frequency of the spectrum grow up to 80% from the maximal effort of a patient with
the increase of the isometric load applied for the biceps of the upper arm. Further
load increment leads to decrease of the muscle activity that is proved by lessening of
power and the average frequency of the spectrum. The same results were described
in the literature for sound myography [111, 154–156].
The changes of intensity fluctuation spectra of the speckle-field, i.e., the
area under the spectral curves during different isometric loads, are shown in
Fig. 5.31a, b.
The changes of power spectral density (PSD) and spectrum power (SP) from
the value of the applied isometric loads are presented in Figs. 5.32 and 5.33. To