

5.5 Study on Optimization of Parameters of Measuring Path …
403
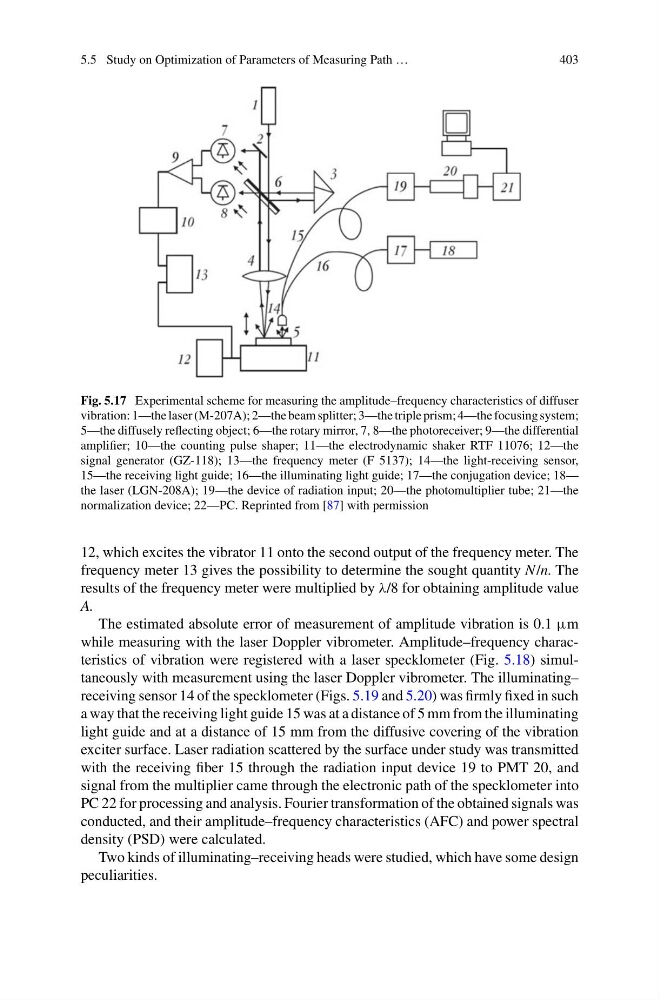
Fig. 5.17 Experimental scheme for measuring the amplitude–frequency characteristics of diffuser
vibration: 1—the laser (M-207A); 2—the beam splitter; 3—the triple prism; 4—the focusing system;
5—the diffusely reflecting object; 6—the rotary mirror, 7, 8—the photoreceiver; 9—the differential
amplifier; 10—the counting pulse shaper; 11—the electrodynamic shaker RTF 11076; 12—the
signal generator (GZ-118); 13—the frequency meter (F 5137); 14—the light-receiving sensor,
15—the receiving light guide; 16—the illuminating light guide; 17—the conjugation device; 18—
the laser (LGN-208A); 19—the device of radiation input; 20—the photomultiplier tube; 21—the
normalization device; 22—PC. Reprinted from [87] with permission
12, which excites the vibrator 11 onto the second output of the frequency meter. The
frequency meter 13 gives the possibility to determine the sought quantity N/n. The
results of the frequency meter were multiplied by λ/8 for obtaining amplitude value
A.
The estimated absolute error of measurement of amplitude vibration is 0.1 μm
while measuring with the laser Doppler vibrometer. Amplitude–frequency characteristics of vibration were registered with a laser specklometer (Fig. 5.18) simultaneously with measurement using the laser Doppler vibrometer. The illuminating–
receiving sensor 14 of the specklometer (Figs. 5.19 and 5.20) was firmly fixed in such
a way that the receiving light guide 15 was at a distance of 5 mm from the illuminating
light guide and at a distance of 15 mm from the diffusive covering of the vibration
exciter surface. Laser radiation scattered by the surface under study was transmitted
with the receiving fiber 15 through the radiation input device 19 to PMT 20, and
signal from the multiplier came through the electronic path of the specklometer into
PC 22 for processing and analysis. Fourier transformation of the obtained signals was
conducted, and their amplitude–frequency characteristics (AFC) and power spectral
density (PSD) were calculated.
Two kinds of illuminating–receiving heads were studied, which have some design
peculiarities.
403
Fig. 5.17 Experimental scheme for measuring the amplitude–frequency characteristics of diffuser
vibration: 1—the laser (M-207A); 2—the beam splitter; 3—the triple prism; 4—the focusing system;
5—the diffusely reflecting object; 6—the rotary mirror, 7, 8—the photoreceiver; 9—the differential
amplifier; 10—the counting pulse shaper; 11—the electrodynamic shaker RTF 11076; 12—the
signal generator (GZ-118); 13—the frequency meter (F 5137); 14—the light-receiving sensor,
15—the receiving light guide; 16—the illuminating light guide; 17—the conjugation device; 18—
the laser (LGN-208A); 19—the device of radiation input; 20—the photomultiplier tube; 21—the
normalization device; 22—PC. Reprinted from [87] with permission
12, which excites the vibrator 11 onto the second output of the frequency meter. The
frequency meter 13 gives the possibility to determine the sought quantity N/n. The
results of the frequency meter were multiplied by λ/8 for obtaining amplitude value
A.
The estimated absolute error of measurement of amplitude vibration is 0.1 μm
while measuring with the laser Doppler vibrometer. Amplitude–frequency characteristics of vibration were registered with a laser specklometer (Fig. 5.18) simultaneously with measurement using the laser Doppler vibrometer. The illuminating–
receiving sensor 14 of the specklometer (Figs. 5.19 and 5.20) was firmly fixed in such
a way that the receiving light guide 15 was at a distance of 5 mm from the illuminating
light guide and at a distance of 15 mm from the diffusive covering of the vibration
exciter surface. Laser radiation scattered by the surface under study was transmitted
with the receiving fiber 15 through the radiation input device 19 to PMT 20, and
signal from the multiplier came through the electronic path of the specklometer into
PC 22 for processing and analysis. Fourier transformation of the obtained signals was
conducted, and their amplitude–frequency characteristics (AFC) and power spectral
density (PSD) were calculated.
Two kinds of illuminating–receiving heads were studied, which have some design
peculiarities.