

5.1 Study of Velocity of Muscle Contraction Using the …
377
n max = n(I 2) = R/σ,
(5.2)
where R is the parameter, which is determined by the geometry of the illuminating
laser beam.
The electrical device compared a high-frequency random signal with a sliding
signal, which corresponded to the average illumination of the speckle-pattern. When
both signal crossed, the trigger transfer occurred. Thus, a sequence of right-angle
pulses was formed on the trigger output. Their duration was determined by the width
of a separate speckle. The electronic device produced n max || v s | pulses per unit time
during the movement of the speckle-structure, which were read by frequency meter.
Thus, the directly measured speckle-counting velocity is just proportional to the
velocity of object movement.
In the conducted experiments, the counting time of the frequency meter was 10
ms and determined time resolution. Average velocity per every 10 s was practically
measured. The frequency meter was launched in a set moment of time from the electrical stimulator through the delay line. The data were averaged on 10 measurements
to increase the accuracy.
Biceps of a frog’s thigh served as the research object. Its length was 20 mm, and
the width was ~2 mm. It was placed into a physiological solution, and the size of the
illuminated area was ~1 mm
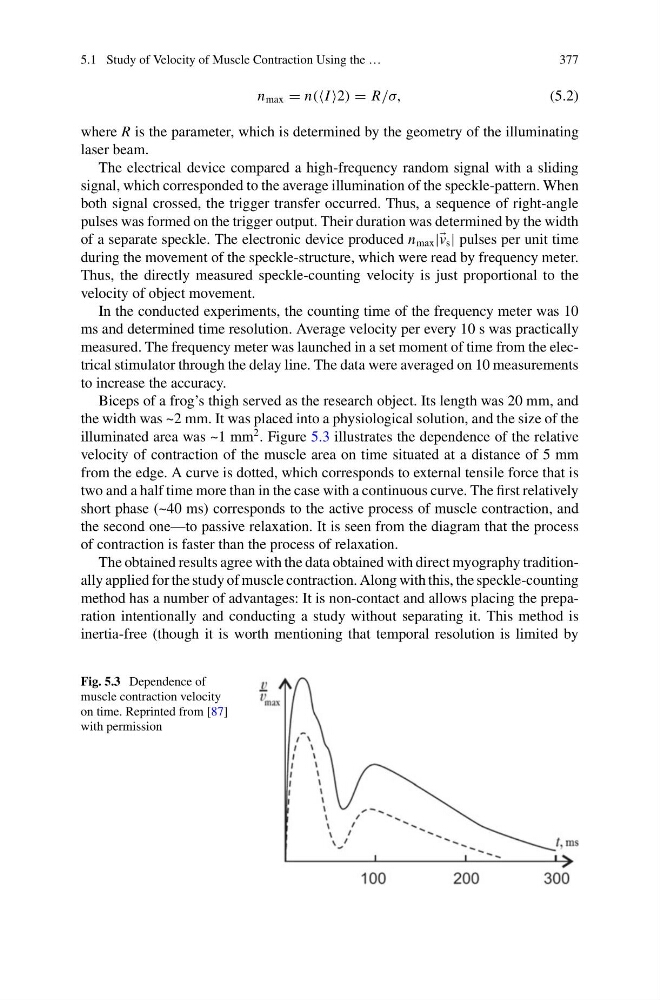
2 . Figure 5.3 illustrates the dependence of the relative
velocity of contraction of the muscle area on time situated at a distance of 5 mm
from the edge. A curve is dotted, which corresponds to external tensile force that is
two and a half time more than in the case with a continuous curve. The first relatively
short phase (~40 ms) corresponds to the active process of muscle contraction, and
the second one—to passive relaxation. It is seen from the diagram that the process
of contraction is faster than the process of relaxation.
The obtained results agree with the data obtained with direct myography traditionally applied for the study of muscle contraction. Along with this, the speckle-counting
method has a number of advantages: It is non-contact and allows placing the preparation intentionally and conducting a study without separating it. This method is
inertia-free (though it is worth mentioning that temporal resolution is limited by
Fig. 5.3 Dependence of
muscle contraction velocity
on time. Reprinted from [87]
with permission
377
n max = n(I 2) = R/σ,
(5.2)
where R is the parameter, which is determined by the geometry of the illuminating
laser beam.
The electrical device compared a high-frequency random signal with a sliding
signal, which corresponded to the average illumination of the speckle-pattern. When
both signal crossed, the trigger transfer occurred. Thus, a sequence of right-angle
pulses was formed on the trigger output. Their duration was determined by the width
of a separate speckle. The electronic device produced n max || v s | pulses per unit time
during the movement of the speckle-structure, which were read by frequency meter.
Thus, the directly measured speckle-counting velocity is just proportional to the
velocity of object movement.
In the conducted experiments, the counting time of the frequency meter was 10
ms and determined time resolution. Average velocity per every 10 s was practically
measured. The frequency meter was launched in a set moment of time from the electrical stimulator through the delay line. The data were averaged on 10 measurements
to increase the accuracy.
Biceps of a frog’s thigh served as the research object. Its length was 20 mm, and
the width was ~2 mm. It was placed into a physiological solution, and the size of the
illuminated area was ~1 mm
2 . Figure 5.3 illustrates the dependence of the relative
velocity of contraction of the muscle area on time situated at a distance of 5 mm
from the edge. A curve is dotted, which corresponds to external tensile force that is
two and a half time more than in the case with a continuous curve. The first relatively
short phase (~40 ms) corresponds to the active process of muscle contraction, and
the second one—to passive relaxation. It is seen from the diagram that the process
of contraction is faster than the process of relaxation.
The obtained results agree with the data obtained with direct myography traditionally applied for the study of muscle contraction. Along with this, the speckle-counting
method has a number of advantages: It is non-contact and allows placing the preparation intentionally and conducting a study without separating it. This method is
inertia-free (though it is worth mentioning that temporal resolution is limited by
Fig. 5.3 Dependence of
muscle contraction velocity
on time. Reprinted from [87]
with permission