

4.4 Application of Spectrum of Dynamic Speckles Intensity …
341
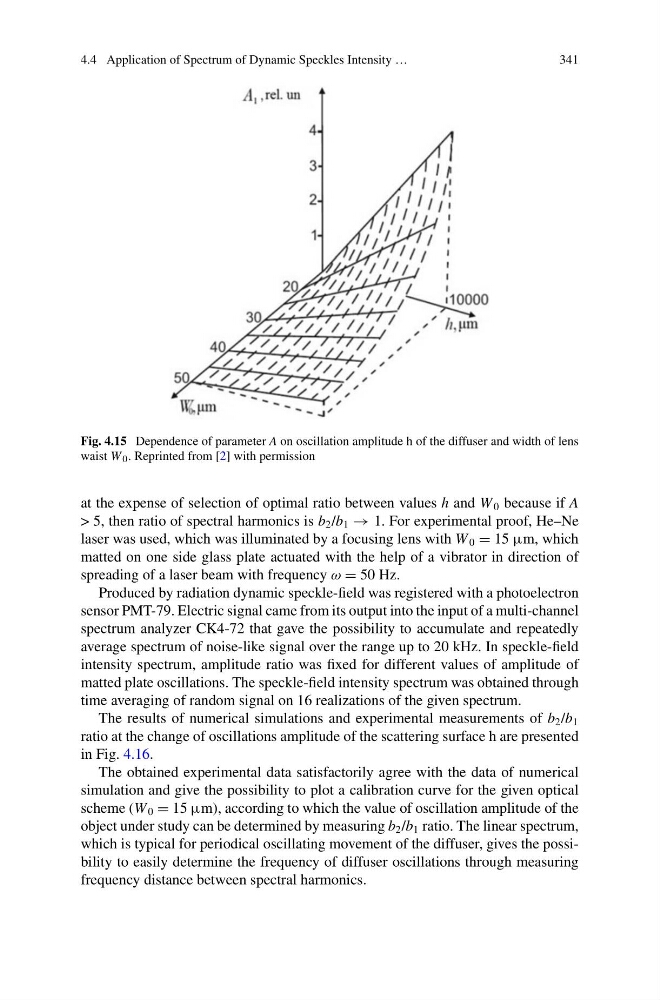
Fig. 4.15 Dependence of parameter A on oscillation amplitude h of the diffuser and width of lens
waist W 0 . Reprinted from [2] with permission
at the expense of selection of optimal ratio between values h and W 0 because if A
> 5, then ratio of spectral harmonics is b 2 /b 1 → 1. For experimental proof, He–Ne
laser was used, which was illuminated by a focusing lens with W 0 = 15 μm, which
matted on one side glass plate actuated with the help of a vibrator in direction of
spreading of a laser beam with frequency ω = 50 Hz.
Produced by radiation dynamic speckle-field was registered with a photoelectron
sensor PMT-79. Electric signal came from its output into the input of a multi-channel
spectrum analyzer CK4-72 that gave the possibility to accumulate and repeatedly
average spectrum of noise-like signal over the range up to 20 kHz. In speckle-field
intensity spectrum, amplitude ratio was fixed for different values of amplitude of
matted plate oscillations. The speckle-field intensity spectrum was obtained through
time averaging of random signal on 16 realizations of the given spectrum.
The results of numerical simulations and experimental measurements of b 2 /b 1
ratio at the change of oscillations amplitude of the scattering surface h are presented
in Fig. 4.16.
The obtained experimental data satisfactorily agree with the data of numerical
simulation and give the possibility to plot a calibration curve for the given optical
scheme (W 0 = 15 μm), according to which the value of oscillation amplitude of the
object under study can be determined by measuring b 2 /b 1 ratio. The linear spectrum,
which is typical for periodical oscillating movement of the diffuser, gives the possibility to easily determine the frequency of diffuser oscillations through measuring
frequency distance between spectral harmonics.
341
Fig. 4.15 Dependence of parameter A on oscillation amplitude h of the diffuser and width of lens
waist W 0 . Reprinted from [2] with permission
at the expense of selection of optimal ratio between values h and W 0 because if A
> 5, then ratio of spectral harmonics is b 2 /b 1 → 1. For experimental proof, He–Ne
laser was used, which was illuminated by a focusing lens with W 0 = 15 μm, which
matted on one side glass plate actuated with the help of a vibrator in direction of
spreading of a laser beam with frequency ω = 50 Hz.
Produced by radiation dynamic speckle-field was registered with a photoelectron
sensor PMT-79. Electric signal came from its output into the input of a multi-channel
spectrum analyzer CK4-72 that gave the possibility to accumulate and repeatedly
average spectrum of noise-like signal over the range up to 20 kHz. In speckle-field
intensity spectrum, amplitude ratio was fixed for different values of amplitude of
matted plate oscillations. The speckle-field intensity spectrum was obtained through
time averaging of random signal on 16 realizations of the given spectrum.
The results of numerical simulations and experimental measurements of b 2 /b 1
ratio at the change of oscillations amplitude of the scattering surface h are presented
in Fig. 4.16.
The obtained experimental data satisfactorily agree with the data of numerical
simulation and give the possibility to plot a calibration curve for the given optical
scheme (W 0 = 15 μm), according to which the value of oscillation amplitude of the
object under study can be determined by measuring b 2 /b 1 ratio. The linear spectrum,
which is typical for periodical oscillating movement of the diffuser, gives the possibility to easily determine the frequency of diffuser oscillations through measuring
frequency distance between spectral harmonics.