

3.2 Holographic Interferometry Using Generation Regime …
225
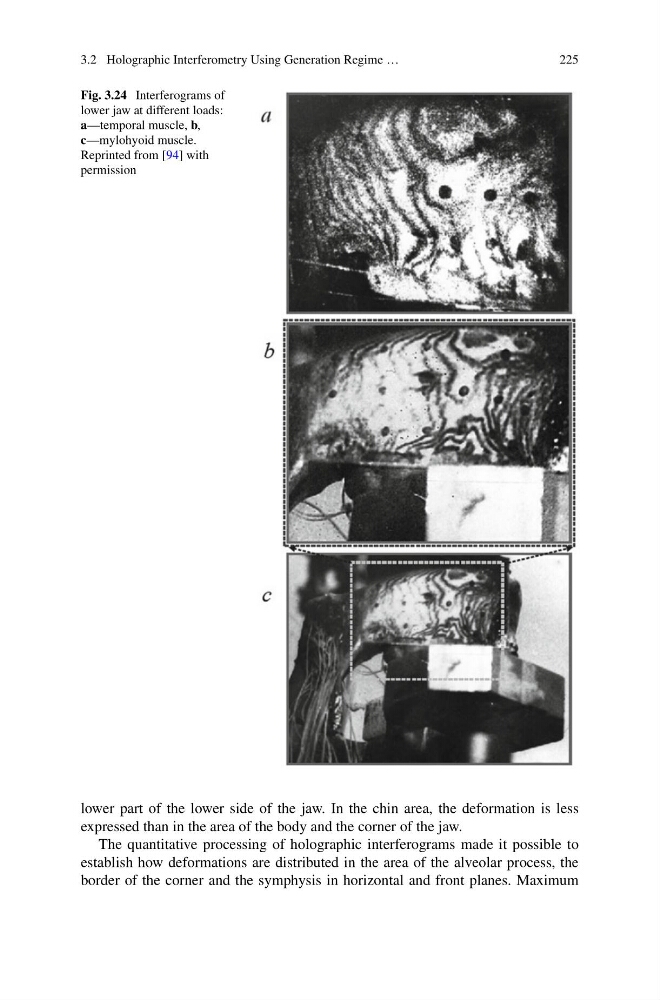
Fig. 3.24 Interferograms of
lower jaw at different loads:
a—temporal muscle, b,
c—mylohyoid muscle.
Reprinted from [94] with
permission
lower part of the lower side of the jaw. In the chin area, the deformation is less
expressed than in the area of the body and the corner of the jaw.
The quantitative processing of holographic interferograms made it possible to
establish how deformations are distributed in the area of the alveolar process, the
border of the corner and the symphysis in horizontal and front planes. Maximum
225
Fig. 3.24 Interferograms of
lower jaw at different loads:
a—temporal muscle, b,
c—mylohyoid muscle.
Reprinted from [94] with
permission
lower part of the lower side of the jaw. In the chin area, the deformation is less
expressed than in the area of the body and the corner of the jaw.
The quantitative processing of holographic interferograms made it possible to
establish how deformations are distributed in the area of the alveolar process, the
border of the corner and the symphysis in horizontal and front planes. Maximum