

206
3 Holographic Interferometry for Studying …
ln
1 +
√
1 − α 2
α
=
ln
R 2 a 2
R 1 a 1
(3.34)
the depth z α doubles.
In this case, the absolute surface relief can also be estimated using the values I max
as a parameter.
It is obvious that the increase enhancing of the regulated depth of the object occurs
due to the transition from the contrast to intensity values in maxima of the interference
pattern during measurements, i.e., due to the transition from relative measurements
to absolute ones. This slightly enhances the requirements to the accuracy of intensity
measurements and to time stability of the illuminating sources.
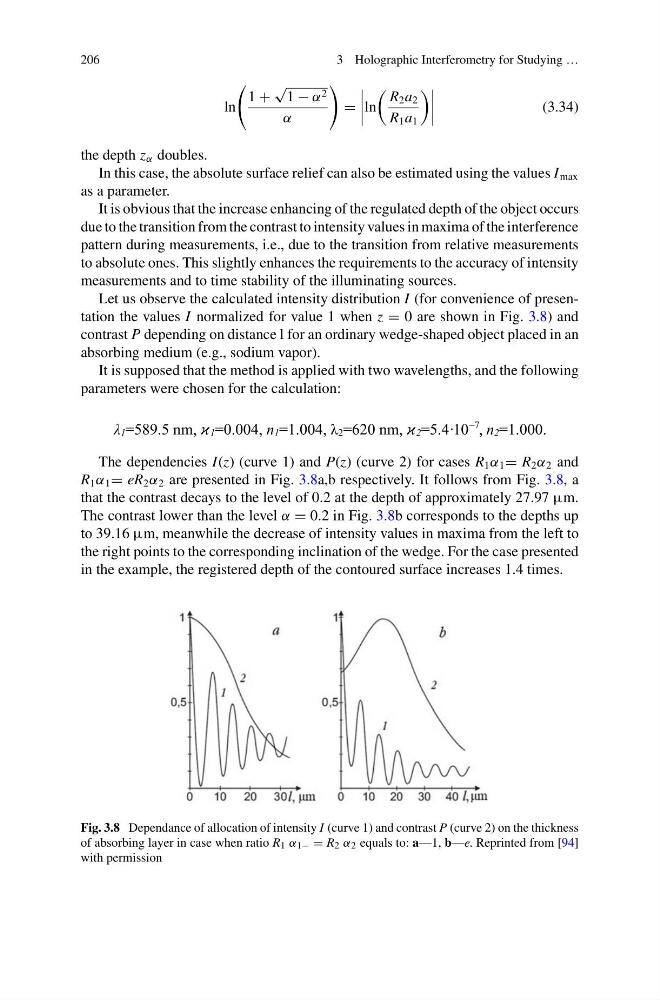
Let us observe the calculated intensity distribution I (for convenience of presentation the values I normalized for value 1 when z = 0 are shown in Fig. 3.8) and
contrast P depending on distance l for an ordinary wedge-shaped object placed in an
absorbing medium (e.g., sodium vapor).
It is supposed that the method is applied with two wavelengths, and the following
parameters were chosen for the calculation:
The dependencies I(z) (curve 1) and P(z) (curve 2) for cases R 1 α 1 = R 2 α 2 and
R 1 α 1 = eR 2 α 2 are presented in Fig. 3.8a,b respectively. It follows from Fig. 3.8, a
that the contrast decays to the level of 0.2 at the depth of approximately 27.97 μm.
The contrast lower than the level α = 0.2 in Fig. 3.8b corresponds to the depths up
to 39.16 μm, meanwhile the decrease of intensity values in maxima from the left to
the right points to the corresponding inclination of the wedge. For the case presented
in the example, the registered depth of the contoured surface increases 1.4 times.
Fig. 3.8 Dependance of allocation of intensity I (curve 1) and contrast P (curve 2) on the thickness
of absorbing layer in case when ratio R 1 α 1− = R 2 α 2 equals to: a—1, b—e. Reprinted from [94]
with permission
3 Holographic Interferometry for Studying …
ln
1 +
√
1 − α 2
α
=
ln
R 2 a 2
R 1 a 1
(3.34)
the depth z α doubles.
In this case, the absolute surface relief can also be estimated using the values I max
as a parameter.
It is obvious that the increase enhancing of the regulated depth of the object occurs
due to the transition from the contrast to intensity values in maxima of the interference
pattern during measurements, i.e., due to the transition from relative measurements
to absolute ones. This slightly enhances the requirements to the accuracy of intensity
measurements and to time stability of the illuminating sources.
Let us observe the calculated intensity distribution I (for convenience of presentation the values I normalized for value 1 when z = 0 are shown in Fig. 3.8) and
contrast P depending on distance l for an ordinary wedge-shaped object placed in an
absorbing medium (e.g., sodium vapor).
It is supposed that the method is applied with two wavelengths, and the following
parameters were chosen for the calculation:
The dependencies I(z) (curve 1) and P(z) (curve 2) for cases R 1 α 1 = R 2 α 2 and
R 1 α 1 = eR 2 α 2 are presented in Fig. 3.8a,b respectively. It follows from Fig. 3.8, a
that the contrast decays to the level of 0.2 at the depth of approximately 27.97 μm.
The contrast lower than the level α = 0.2 in Fig. 3.8b corresponds to the depths up
to 39.16 μm, meanwhile the decrease of intensity values in maxima from the left to
the right points to the corresponding inclination of the wedge. For the case presented
in the example, the registered depth of the contoured surface increases 1.4 times.
Fig. 3.8 Dependance of allocation of intensity I (curve 1) and contrast P (curve 2) on the thickness
of absorbing layer in case when ratio R 1 α 1− = R 2 α 2 equals to: a—1, b—e. Reprinted from [94]
with permission