

198
3 Holographic Interferometry for Studying …
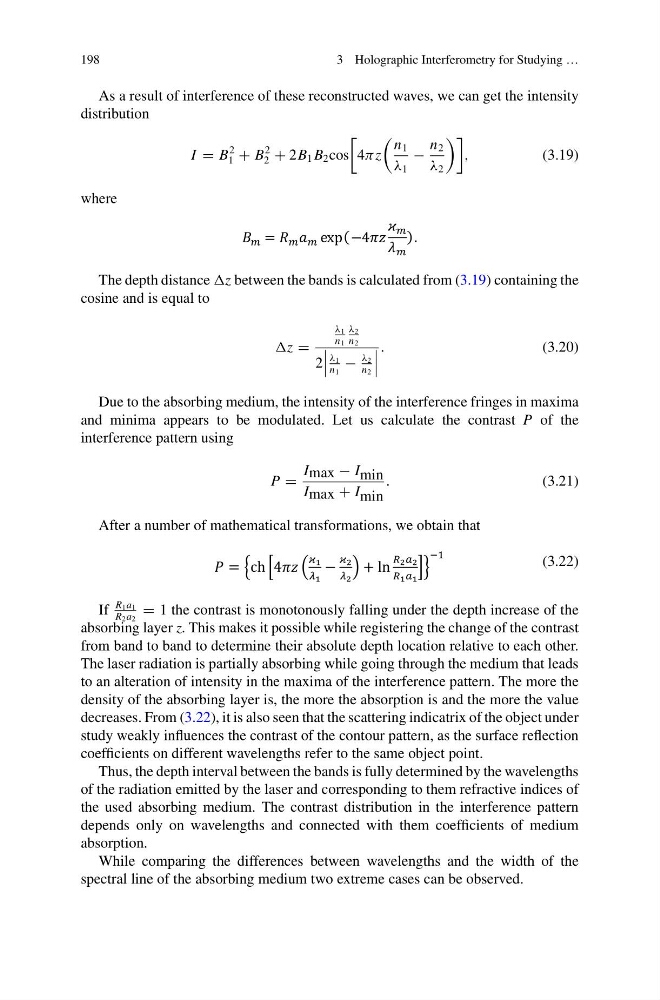
As a result of interference of these reconstructed waves, we can get the intensity
distribution
I = B
2
1 + B
2
2 + 2B 1 B 2 cos
4π z
n 1
λ 1
−
n 2
λ 2
,
(3.19)
where
The depth distance between the bands is calculated from (3.19) containing the
cosine and is equal to
=
λ 1
n 1
λ 2
n 2
2
λ 1
n 1
−
λ 2
n 2
.
(3.20)
Due to the absorbing medium, the intensity of the interference fringes in maxima
and minima appears to be modulated. Let us calculate the contrast P of the
interference pattern using
P =
I max − I min
I max + I min
.
(3.21)
After a number of mathematical transformations, we obtain that
(3.22)
If
R 1 a 1
R 2 a 2
= 1 the contrast is monotonously falling under the depth increase of the
absorbing layer z. This makes it possible while registering the change of the contrast
from band to band to determine their absolute depth location relative to each other.
The laser radiation is partially absorbing while going through the medium that leads
to an alteration of intensity in the maxima of the interference pattern. The more the
density of the absorbing layer is, the more the absorption is and the more the value
decreases. From (3.22), it is also seen that the scattering indicatrix of the object under
study weakly influences the contrast of the contour pattern, as the surface reflection
coefficients on different wavelengths refer to the same object point.
Thus, the depth interval between the bands is fully determined by the wavelengths
of the radiation emitted by the laser and corresponding to them refractive indices of
the used absorbing medium. The contrast distribution in the interference pattern
depends only on wavelengths and connected with them coefficients of medium
absorption.
While comparing the differences between wavelengths and the width of the
spectral line of the absorbing medium two extreme cases can be observed.
3 Holographic Interferometry for Studying …
As a result of interference of these reconstructed waves, we can get the intensity
distribution
I = B
2
1 + B
2
2 + 2B 1 B 2 cos
4π z
n 1
λ 1
−
n 2
λ 2
,
(3.19)
where
The depth distance between the bands is calculated from (3.19) containing the
cosine and is equal to
=
λ 1
n 1
λ 2
n 2
2
λ 1
n 1
−
λ 2
n 2
.
(3.20)
Due to the absorbing medium, the intensity of the interference fringes in maxima
and minima appears to be modulated. Let us calculate the contrast P of the
interference pattern using
P =
I max − I min
I max + I min
.
(3.21)
After a number of mathematical transformations, we obtain that
(3.22)
If
R 1 a 1
R 2 a 2
= 1 the contrast is monotonously falling under the depth increase of the
absorbing layer z. This makes it possible while registering the change of the contrast
from band to band to determine their absolute depth location relative to each other.
The laser radiation is partially absorbing while going through the medium that leads
to an alteration of intensity in the maxima of the interference pattern. The more the
density of the absorbing layer is, the more the absorption is and the more the value
decreases. From (3.22), it is also seen that the scattering indicatrix of the object under
study weakly influences the contrast of the contour pattern, as the surface reflection
coefficients on different wavelengths refer to the same object point.
Thus, the depth interval between the bands is fully determined by the wavelengths
of the radiation emitted by the laser and corresponding to them refractive indices of
the used absorbing medium. The contrast distribution in the interference pattern
depends only on wavelengths and connected with them coefficients of medium
absorption.
While comparing the differences between wavelengths and the width of the
spectral line of the absorbing medium two extreme cases can be observed.