

2.3 Holographic Study with Electrophysiological Control …
135
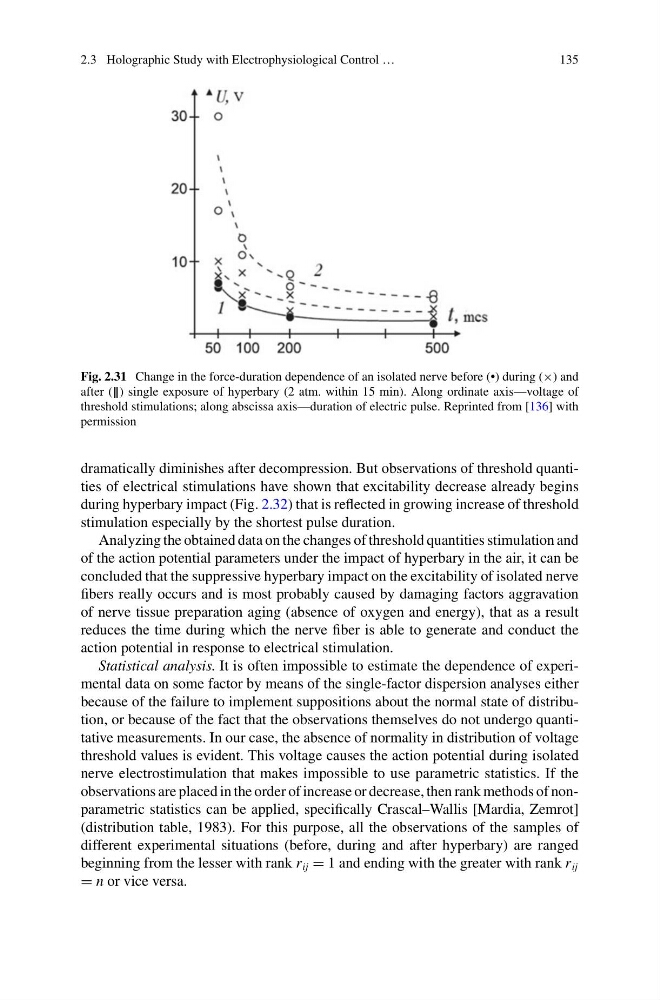
Fig. 2.31 Change in the force-duration dependence of an isolated nerve before (•) during (×) and
after () single exposure of hyperbary (2 atm. within 15 min). Along ordinate axis—voltage of
threshold stimulations; along abscissa axis—duration of electric pulse. Reprinted from [136] with
permission
dramatically diminishes after decompression. But observations of threshold quantities of electrical stimulations have shown that excitability decrease already begins
during hyperbary impact (Fig. 2.32) that is reflected in growing increase of threshold
stimulation especially by the shortest pulse duration.
Analyzing the obtained data on the changes of threshold quantities stimulation and
of the action potential parameters under the impact of hyperbary in the air, it can be
concluded that the suppressive hyperbary impact on the excitability of isolated nerve
fibers really occurs and is most probably caused by damaging factors aggravation
of nerve tissue preparation aging (absence of oxygen and energy), that as a result
reduces the time during which the nerve fiber is able to generate and conduct the
action potential in response to electrical stimulation.
Statistical analysis. It is often impossible to estimate the dependence of experimental data on some factor by means of the single-factor dispersion analyses either
because of the failure to implement suppositions about the normal state of distribution, or because of the fact that the observations themselves do not undergo quantitative measurements. In our case, the absence of normality in distribution of voltage
threshold values is evident. This voltage causes the action potential during isolated
nerve electrostimulation that makes impossible to use parametric statistics. If the
observations are placed in the order of increase or decrease, then rank methods of nonparametric statistics can be applied, specifically Crascal–Wallis [Mardia, Zemrot]
(distribution table, 1983). For this purpose, all the observations of the samples of
different experimental situations (before, during and after hyperbary) are ranged
beginning from the lesser with rank r ij = 1 and ending with the greater with rank r ij
= n or vice versa.
135
Fig. 2.31 Change in the force-duration dependence of an isolated nerve before (•) during (×) and
after () single exposure of hyperbary (2 atm. within 15 min). Along ordinate axis—voltage of
threshold stimulations; along abscissa axis—duration of electric pulse. Reprinted from [136] with
permission
dramatically diminishes after decompression. But observations of threshold quantities of electrical stimulations have shown that excitability decrease already begins
during hyperbary impact (Fig. 2.32) that is reflected in growing increase of threshold
stimulation especially by the shortest pulse duration.
Analyzing the obtained data on the changes of threshold quantities stimulation and
of the action potential parameters under the impact of hyperbary in the air, it can be
concluded that the suppressive hyperbary impact on the excitability of isolated nerve
fibers really occurs and is most probably caused by damaging factors aggravation
of nerve tissue preparation aging (absence of oxygen and energy), that as a result
reduces the time during which the nerve fiber is able to generate and conduct the
action potential in response to electrical stimulation.
Statistical analysis. It is often impossible to estimate the dependence of experimental data on some factor by means of the single-factor dispersion analyses either
because of the failure to implement suppositions about the normal state of distribution, or because of the fact that the observations themselves do not undergo quantitative measurements. In our case, the absence of normality in distribution of voltage
threshold values is evident. This voltage causes the action potential during isolated
nerve electrostimulation that makes impossible to use parametric statistics. If the
observations are placed in the order of increase or decrease, then rank methods of nonparametric statistics can be applied, specifically Crascal–Wallis [Mardia, Zemrot]
(distribution table, 1983). For this purpose, all the observations of the samples of
different experimental situations (before, during and after hyperbary) are ranged
beginning from the lesser with rank r ij = 1 and ending with the greater with rank r ij
= n or vice versa.