

60
2 Model of Quasi-Steady Weld Pool Dynamics and Numerical Simulation
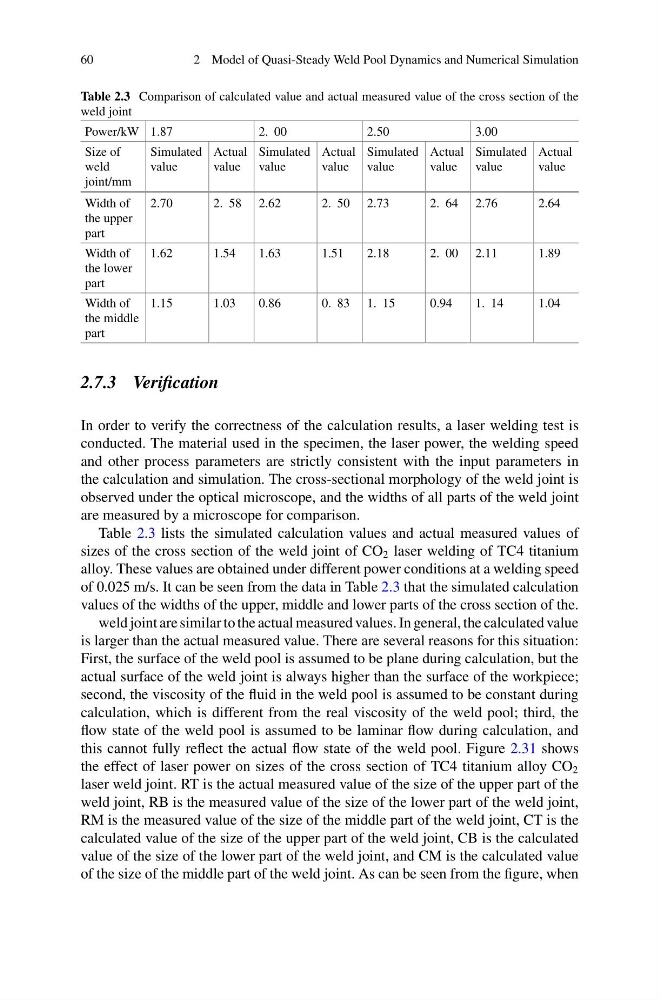
Table 2.3 Comparison of calculated value and actual measured value of the cross section of the
weld joint
Power/kW 1.87
2. 00
2.50
3.00
Size of
weld
joint/mm
Simulated
value
Actual
value
Simulated
value
Actual
value
Simulated
value
Actual
value
Simulated
value
Actual
value
Width of
the upper
part
2.70
2. 58 2.62
2. 50 2.73
2. 64 2.76
2.64
Width of
the lower
part
1.62
1.54
1.63
1.51
2.18
2. 00 2.11
1.89
Width of
the middle
part
1.15
1.03
0.86
0. 83 1. 15
0.94
1. 14
1.04
2.7.3 Verification
In order to verify the correctness of the calculation results, a laser welding test is
conducted. The material used in the specimen, the laser power, the welding speed
and other process parameters are strictly consistent with the input parameters in
the calculation and simulation. The cross-sectional morphology of the weld joint is
observed under the optical microscope, and the widths of all parts of the weld joint
are measured by a microscope for comparison.
Table 2.3 lists the simulated calculation values and actual measured values of
sizes of the cross section of the weld joint of CO 2 laser welding of TC4 titanium
alloy. These values are obtained under different power conditions at a welding speed
of 0.025 m/s. It can be seen from the data in Table 2.3 that the simulated calculation
values of the widths of the upper, middle and lower parts of the cross section of the.
weld joint are similar to the actual measured values. In general, the calculated value
is larger than the actual measured value. There are several reasons for this situation:
First, the surface of the weld pool is assumed to be plane during calculation, but the
actual surface of the weld joint is always higher than the surface of the workpiece;
second, the viscosity of the fluid in the weld pool is assumed to be constant during
calculation, which is different from the real viscosity of the weld pool; third, the
flow state of the weld pool is assumed to be laminar flow during calculation, and
this cannot fully reflect the actual flow state of the weld pool. Figure 2.31 shows
the effect of laser power on sizes of the cross section of TC4 titanium alloy CO 2
laser weld joint. RT is the actual measured value of the size of the upper part of the
weld joint, RB is the measured value of the size of the lower part of the weld joint,
RM is the measured value of the size of the middle part of the weld joint, CT is the
calculated value of the size of the upper part of the weld joint, CB is the calculated
value of the size of the lower part of the weld joint, and CM is the calculated value
of the size of the middle part of the weld joint. As can be seen from the figure, when
2 Model of Quasi-Steady Weld Pool Dynamics and Numerical Simulation
Table 2.3 Comparison of calculated value and actual measured value of the cross section of the
weld joint
Power/kW 1.87
2. 00
2.50
3.00
Size of
weld
joint/mm
Simulated
value
Actual
value
Simulated
value
Actual
value
Simulated
value
Actual
value
Simulated
value
Actual
value
Width of
the upper
part
2.70
2. 58 2.62
2. 50 2.73
2. 64 2.76
2.64
Width of
the lower
part
1.62
1.54
1.63
1.51
2.18
2. 00 2.11
1.89
Width of
the middle
part
1.15
1.03
0.86
0. 83 1. 15
0.94
1. 14
1.04
2.7.3 Verification
In order to verify the correctness of the calculation results, a laser welding test is
conducted. The material used in the specimen, the laser power, the welding speed
and other process parameters are strictly consistent with the input parameters in
the calculation and simulation. The cross-sectional morphology of the weld joint is
observed under the optical microscope, and the widths of all parts of the weld joint
are measured by a microscope for comparison.
Table 2.3 lists the simulated calculation values and actual measured values of
sizes of the cross section of the weld joint of CO 2 laser welding of TC4 titanium
alloy. These values are obtained under different power conditions at a welding speed
of 0.025 m/s. It can be seen from the data in Table 2.3 that the simulated calculation
values of the widths of the upper, middle and lower parts of the cross section of the.
weld joint are similar to the actual measured values. In general, the calculated value
is larger than the actual measured value. There are several reasons for this situation:
First, the surface of the weld pool is assumed to be plane during calculation, but the
actual surface of the weld joint is always higher than the surface of the workpiece;
second, the viscosity of the fluid in the weld pool is assumed to be constant during
calculation, which is different from the real viscosity of the weld pool; third, the
flow state of the weld pool is assumed to be laminar flow during calculation, and
this cannot fully reflect the actual flow state of the weld pool. Figure 2.31 shows
the effect of laser power on sizes of the cross section of TC4 titanium alloy CO 2
laser weld joint. RT is the actual measured value of the size of the upper part of the
weld joint, RB is the measured value of the size of the lower part of the weld joint,
RM is the measured value of the size of the middle part of the weld joint, CT is the
calculated value of the size of the upper part of the weld joint, CB is the calculated
value of the size of the lower part of the weld joint, and CM is the calculated value
of the size of the middle part of the weld joint. As can be seen from the figure, when