

238
8 Keyhole and Weld Pool Dynamics in Laser Welding with Filler Wires
(b) Longitudinal section B
(a) Longitudinal section A
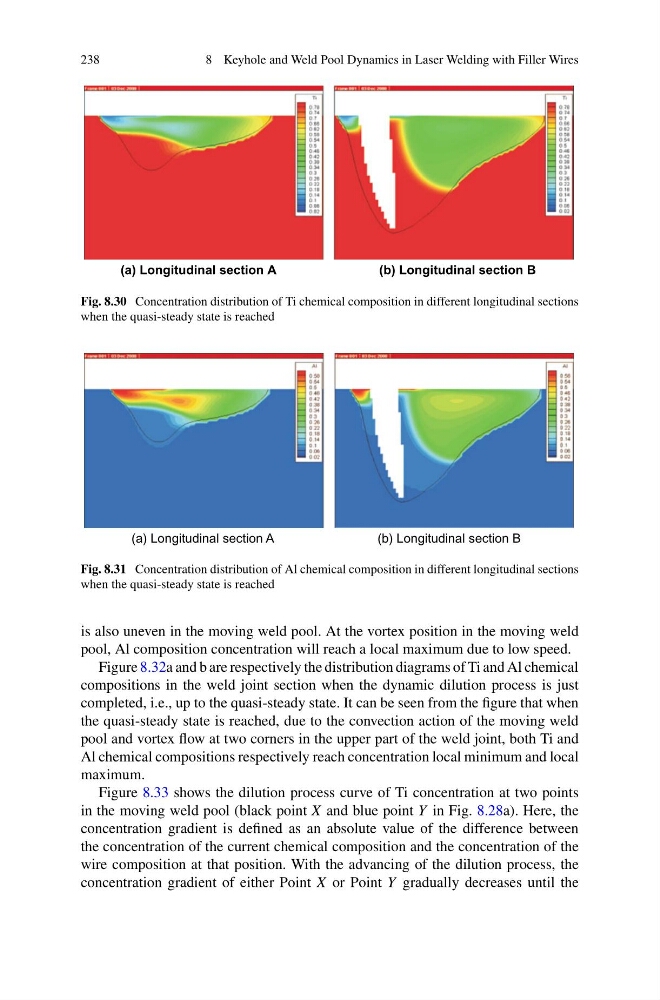
Fig. 8.30 Concentration distribution of Ti chemical composition in different longitudinal sections
when the quasi-steady state is reached
(a) Longitudinal section A
(b) Longitudinal section B
Fig. 8.31 Concentration distribution of Al chemical composition in different longitudinal sections
when the quasi-steady state is reached
is also uneven in the moving weld pool. At the vortex position in the moving weld
pool, Al composition concentration will reach a local maximum due to low speed.
Figure 8.32a and b are respectively the distribution diagrams of Ti and Al chemical
compositions in the weld joint section when the dynamic dilution process is just
completed, i.e., up to the quasi-steady state. It can be seen from the figure that when
the quasi-steady state is reached, due to the convection action of the moving weld
pool and vortex flow at two corners in the upper part of the weld joint, both Ti and
Al chemical compositions respectively reach concentration local minimum and local
maximum.
Figure 8.33 shows the dilution process curve of Ti concentration at two points
in the moving weld pool (black point X and blue point Y in Fig. 8.28a). Here, the
concentration gradient is defined as an absolute value of the difference between
the concentration of the current chemical composition and the concentration of the
wire composition at that position. With the advancing of the dilution process, the
concentration gradient of either Point X or Point Y gradually decreases until the
8 Keyhole and Weld Pool Dynamics in Laser Welding with Filler Wires
(b) Longitudinal section B
(a) Longitudinal section A
Fig. 8.30 Concentration distribution of Ti chemical composition in different longitudinal sections
when the quasi-steady state is reached
(a) Longitudinal section A
(b) Longitudinal section B
Fig. 8.31 Concentration distribution of Al chemical composition in different longitudinal sections
when the quasi-steady state is reached
is also uneven in the moving weld pool. At the vortex position in the moving weld
pool, Al composition concentration will reach a local maximum due to low speed.
Figure 8.32a and b are respectively the distribution diagrams of Ti and Al chemical
compositions in the weld joint section when the dynamic dilution process is just
completed, i.e., up to the quasi-steady state. It can be seen from the figure that when
the quasi-steady state is reached, due to the convection action of the moving weld
pool and vortex flow at two corners in the upper part of the weld joint, both Ti and
Al chemical compositions respectively reach concentration local minimum and local
maximum.
Figure 8.33 shows the dilution process curve of Ti concentration at two points
in the moving weld pool (black point X and blue point Y in Fig. 8.28a). Here, the
concentration gradient is defined as an absolute value of the difference between
the concentration of the current chemical composition and the concentration of the
wire composition at that position. With the advancing of the dilution process, the
concentration gradient of either Point X or Point Y gradually decreases until the