

212
8 Keyhole and Weld Pool Dynamics in Laser Welding with Filler Wires
(b) Weld pool morphology
(f) Free interface morphology
(e) Weld pool morphology
(d) Keyhole longitudinal-section
morphology
(a) Keyhole longitudinal-section
(c) Free interface morphology
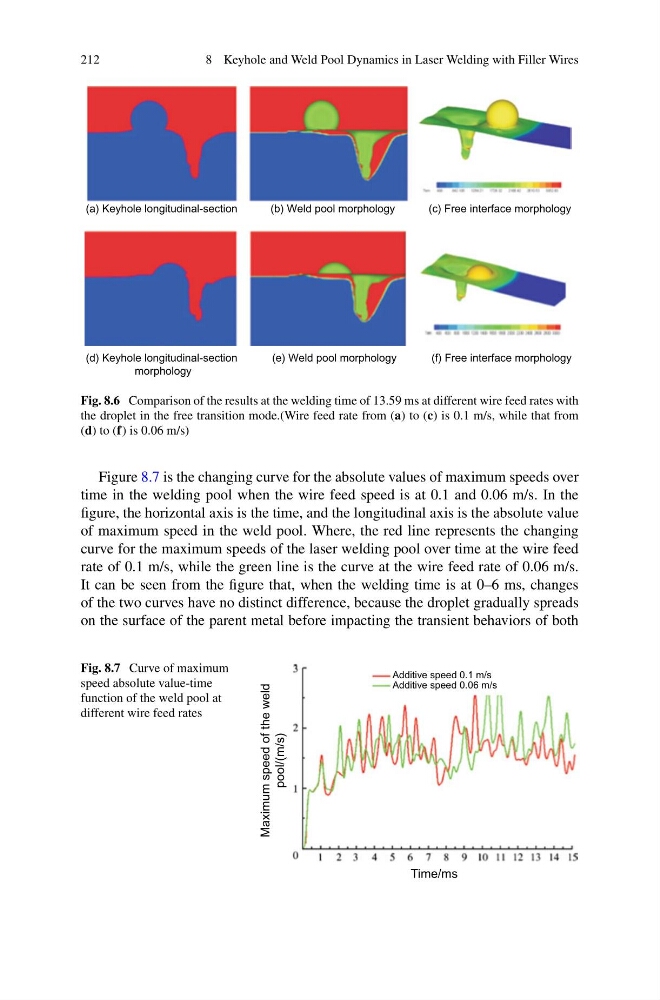
Fig. 8.6 Comparison of the results at the welding time of 13.59 ms at different wire feed rates with
the droplet in the free transition mode.(Wire feed rate from (a) to (c) is 0.1 m/s, while that from
(d) to (f) is 0.06 m/s)
Figure 8.7 is the changing curve for the absolute values of maximum speeds over
time in the welding pool when the wire feed speed is at 0.1 and 0.06 m/s. In the
figure, the horizontal axis is the time, and the longitudinal axis is the absolute value
of maximum speed in the weld pool. Where, the red line represents the changing
curve for the maximum speeds of the laser welding pool over time at the wire feed
rate of 0.1 m/s, while the green line is the curve at the wire feed rate of 0.06 m/s.
It can be seen from the figure that, when the welding time is at 0–6 ms, changes
of the two curves have no distinct difference, because the droplet gradually spreads
on the surface of the parent metal before impacting the transient behaviors of both
Fig. 8.7 Curve of maximum
speed absolute value-time
function of the weld pool at
different wire feed rates
Time/ms
Maximum speed of the weld
pool/(m/s)
Additive speed 0.1 m/s
Additive speed 0.06 m/s
8 Keyhole and Weld Pool Dynamics in Laser Welding with Filler Wires
(b) Weld pool morphology
(f) Free interface morphology
(e) Weld pool morphology
(d) Keyhole longitudinal-section
morphology
(a) Keyhole longitudinal-section
(c) Free interface morphology
Fig. 8.6 Comparison of the results at the welding time of 13.59 ms at different wire feed rates with
the droplet in the free transition mode.(Wire feed rate from (a) to (c) is 0.1 m/s, while that from
(d) to (f) is 0.06 m/s)
Figure 8.7 is the changing curve for the absolute values of maximum speeds over
time in the welding pool when the wire feed speed is at 0.1 and 0.06 m/s. In the
figure, the horizontal axis is the time, and the longitudinal axis is the absolute value
of maximum speed in the weld pool. Where, the red line represents the changing
curve for the maximum speeds of the laser welding pool over time at the wire feed
rate of 0.1 m/s, while the green line is the curve at the wire feed rate of 0.06 m/s.
It can be seen from the figure that, when the welding time is at 0–6 ms, changes
of the two curves have no distinct difference, because the droplet gradually spreads
on the surface of the parent metal before impacting the transient behaviors of both
Fig. 8.7 Curve of maximum
speed absolute value-time
function of the weld pool at
different wire feed rates
Time/ms
Maximum speed of the weld
pool/(m/s)
Additive speed 0.1 m/s
Additive speed 0.06 m/s