

88
3 Coupling Model and Numerical Computation Method of Keyhole and Weld Pool
Table 3.1 Comparison between the calculated values of incidence/reflection directions and the
theoretical values of 60° V groove
Location/theoretical
value
Incidence
direction
First reflection
direction
Second
reflection
direction
Third reflection
direction
A
(0, 0, 1)
(−0.866, 0,
0.4999)
(0.866, 0, −
0.5)
(−2e−8, 0, −
0.9999)
B
(0, 0, 1)
(−0.866, 0,
0.4999)
(0.865, 0, −
0.501)
(6e−8, 0, −
0.9999)
Theoretical value
(0, 0, 1)
(−0.866, 0, 0.5)
(0.866, 0, −
0.5)
(0, 0, −1)
that there is only one reflection at the groove bottom. Figure 3.3c shows the 3D
nephogram of energy distribution on the V groove surface by calculation. It can be
seen from the figure, since there is only one reflection at the groove bottom, the
maximum energy appears on both sides near the V groove bottom. Due to the small
number of reflections, the energy distribution is still basically a Gaussian distribution.
The above facts further verify the rationality of this method.
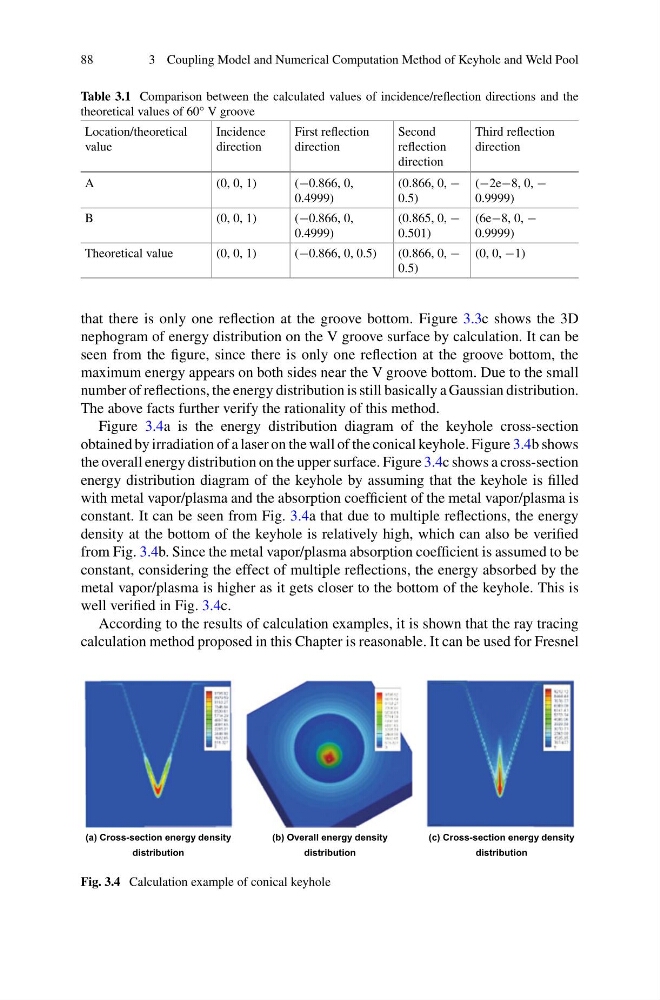
Figure 3.4a is the energy distribution diagram of the keyhole cross-section
obtained by irradiation of a laser on the wall of the conical keyhole. Figure 3.4b shows
the overall energy distribution on the upper surface. Figure 3.4c shows a cross-section
energy distribution diagram of the keyhole by assuming that the keyhole is filled
with metal vapor/plasma and the absorption coefficient of the metal vapor/plasma is
constant. It can be seen from Fig. 3.4a that due to multiple reflections, the energy
density at the bottom of the keyhole is relatively high, which can also be verified
from Fig. 3.4b. Since the metal vapor/plasma absorption coefficient is assumed to be
constant, considering the effect of multiple reflections, the energy absorbed by the
metal vapor/plasma is higher as it gets closer to the bottom of the keyhole. This is
well verified in Fig. 3.4c.
According to the results of calculation examples, it is shown that the ray tracing
calculation method proposed in this Chapter is reasonable. It can be used for Fresnel
(a) Cross-section energy density
distribution
(b) Overall energy density
distribution
(c) Cross-section energy density
distribution
Fig. 3.4 Calculation example of conical keyhole
3 Coupling Model and Numerical Computation Method of Keyhole and Weld Pool
Table 3.1 Comparison between the calculated values of incidence/reflection directions and the
theoretical values of 60° V groove
Location/theoretical
value
Incidence
direction
First reflection
direction
Second
reflection
direction
Third reflection
direction
A
(0, 0, 1)
(−0.866, 0,
0.4999)
(0.866, 0, −
0.5)
(−2e−8, 0, −
0.9999)
B
(0, 0, 1)
(−0.866, 0,
0.4999)
(0.865, 0, −
0.501)
(6e−8, 0, −
0.9999)
Theoretical value
(0, 0, 1)
(−0.866, 0, 0.5)
(0.866, 0, −
0.5)
(0, 0, −1)
that there is only one reflection at the groove bottom. Figure 3.3c shows the 3D
nephogram of energy distribution on the V groove surface by calculation. It can be
seen from the figure, since there is only one reflection at the groove bottom, the
maximum energy appears on both sides near the V groove bottom. Due to the small
number of reflections, the energy distribution is still basically a Gaussian distribution.
The above facts further verify the rationality of this method.
Figure 3.4a is the energy distribution diagram of the keyhole cross-section
obtained by irradiation of a laser on the wall of the conical keyhole. Figure 3.4b shows
the overall energy distribution on the upper surface. Figure 3.4c shows a cross-section
energy distribution diagram of the keyhole by assuming that the keyhole is filled
with metal vapor/plasma and the absorption coefficient of the metal vapor/plasma is
constant. It can be seen from Fig. 3.4a that due to multiple reflections, the energy
density at the bottom of the keyhole is relatively high, which can also be verified
from Fig. 3.4b. Since the metal vapor/plasma absorption coefficient is assumed to be
constant, considering the effect of multiple reflections, the energy absorbed by the
metal vapor/plasma is higher as it gets closer to the bottom of the keyhole. This is
well verified in Fig. 3.4c.
According to the results of calculation examples, it is shown that the ray tracing
calculation method proposed in this Chapter is reasonable. It can be used for Fresnel
(a) Cross-section energy density
distribution
(b) Overall energy density
distribution
(c) Cross-section energy density
distribution
Fig. 3.4 Calculation example of conical keyhole