

11.5 Crystalline Anisotropy and TiO 2
307
-39900
-39800
-39700
-39600
-39500
-39400
-39300
-39200
-39100
0
2
4
6
8
10
Frequency (GHz)
H (kgauss)
Spectrum for Exchange Interaction
1
2
3
4
5
6
7
8
9
10
11
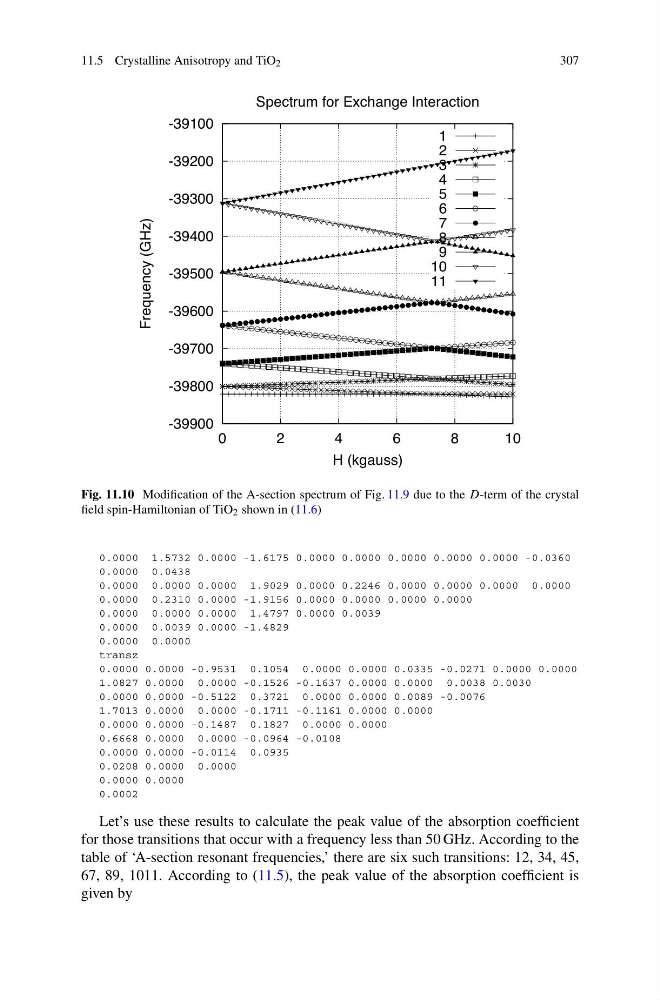
Fig. 11.10 Modification of the A-section spectrum of Fig. 11.9 due to the D-term of the crystal
field spin-Hamiltonian of TiO 2 shown in (11.6)
0.0000 1.5732 0.0000 -1.6175 0.0000 0.0000 0.0000 0.0000 0.0000 -0.0360
0.0000 0.0438
0.0000 0.0000 0.0000 1.9029 0.0000 0.2246 0.0000 0.0000 0.0000 0.0000
0.0000 0.2310 0.0000 -1.9156 0.0000 0.0000 0.0000 0.0000
0.0000 0.0000 0.0000 1.4797 0.0000 0.0039
0.0000 0.0039 0.0000 -1.4829
0.0000 0.0000
transz
0.0000 0.0000 -0.9531 0.1054 0.0000 0.0000 0.0335 -0.0271 0.0000 0.0000
1.0827 0.0000 0.0000 -0.1526 -0.1637 0.0000 0.0000 0.0038 0.0030
0.0000 0.0000 -0.5122 0.3721 0.0000 0.0000 0.0089 -0.0076
1.7013 0.0000 0.0000 -0.1711 -0.1161 0.0000 0.0000
0.0000 0.0000 -0.1487 0.1827 0.0000 0.0000
0.6668 0.0000 0.0000 -0.0964 -0.0108
0.0000 0.0000 -0.0114 0.0935
0.0208 0.0000 0.0000
0.0000 0.0000
0.0002
Let’s use these results to calculate the peak value of the absorption coefficient
for those transitions that occur with a frequency less than 50 GHz. According to the
table of ‘A-section resonant frequencies,’ there are six such transitions: 12, 34, 45,
67, 89, 1011. According to (11.5), the peak value of the absorption coefficient is
given by
307
-39900
-39800
-39700
-39600
-39500
-39400
-39300
-39200
-39100
0
2
4
6
8
10
Frequency (GHz)
H (kgauss)
Spectrum for Exchange Interaction
1
2
3
4
5
6
7
8
9
10
11
Fig. 11.10 Modification of the A-section spectrum of Fig. 11.9 due to the D-term of the crystal
field spin-Hamiltonian of TiO 2 shown in (11.6)
0.0000 1.5732 0.0000 -1.6175 0.0000 0.0000 0.0000 0.0000 0.0000 -0.0360
0.0000 0.0438
0.0000 0.0000 0.0000 1.9029 0.0000 0.2246 0.0000 0.0000 0.0000 0.0000
0.0000 0.2310 0.0000 -1.9156 0.0000 0.0000 0.0000 0.0000
0.0000 0.0000 0.0000 1.4797 0.0000 0.0039
0.0000 0.0039 0.0000 -1.4829
0.0000 0.0000
transz
0.0000 0.0000 -0.9531 0.1054 0.0000 0.0000 0.0335 -0.0271 0.0000 0.0000
1.0827 0.0000 0.0000 -0.1526 -0.1637 0.0000 0.0000 0.0038 0.0030
0.0000 0.0000 -0.5122 0.3721 0.0000 0.0000 0.0089 -0.0076
1.7013 0.0000 0.0000 -0.1711 -0.1161 0.0000 0.0000
0.0000 0.0000 -0.1487 0.1827 0.0000 0.0000
0.6668 0.0000 0.0000 -0.0964 -0.0108
0.0000 0.0000 -0.0114 0.0935
0.0208 0.0000 0.0000
0.0000 0.0000
0.0002
Let’s use these results to calculate the peak value of the absorption coefficient
for those transitions that occur with a frequency less than 50 GHz. According to the
table of ‘A-section resonant frequencies,’ there are six such transitions: 12, 34, 45,
67, 89, 1011. According to (11.5), the peak value of the absorption coefficient is
given by