

270
10 Characterization of Atherosclerotic Lesions by Inversion of Eddy-. . .
Table 10.15 Y p for the
21.6 mm single-turn loop.
The frequency is in MHz
Freq.
Re
Im
59.000 7.68299869E-05 8.89377407E-05
61.250 6.22287553E-05 1.93887259E-04
63.500 2.16324188E-05 2.83220172E-04
65.750 4.39594660E-05 1.97137473E-04
68.000 1.19457676E-04 2.75384256E-04
482.00
1.71300489E-04 4.02158825E-03
484.25
1.64257421E-04 4.02043480E-03
486.50
1.66601327E-04 4.04098304E-03
488.75
1.59304051E-04 4.05691052E-03
491.00
1.54539463E-04 4.07911092E-03
493.25
1.56246097E-04 4.09630826E-03
495.50
1.56481488E-04 4.11793403E-03
497.75
1.59386982E-04 4.13913047E-03
500.00
1.57347269E-04 4.16233204E-03
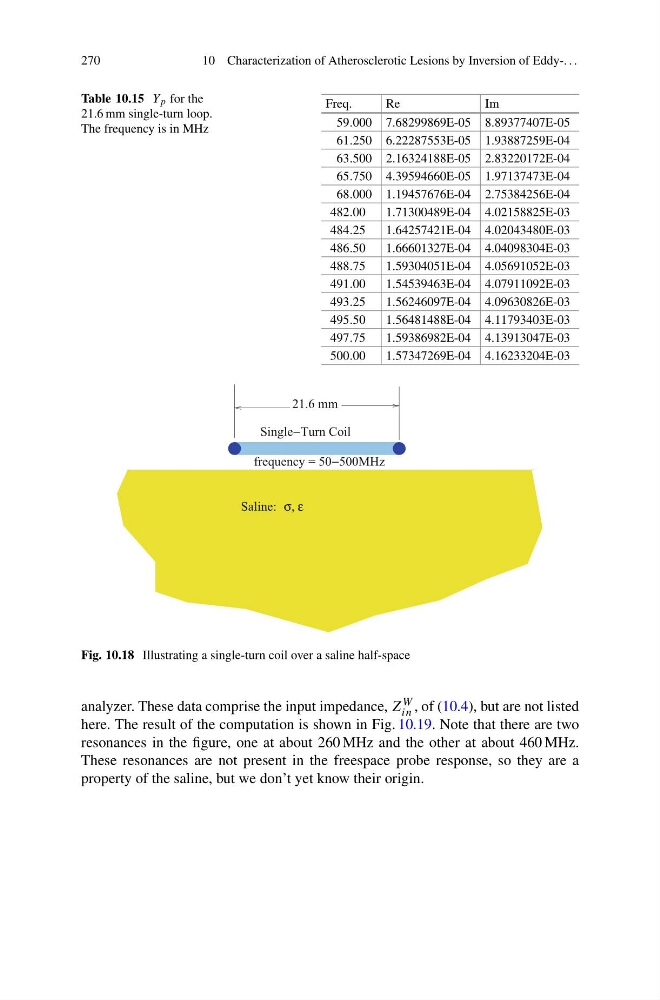
21.6 mm
frequency = 50−500MHz
Single−Turn Coil
Saline: σ, ε
Fig. 10.18 Illustrating a single-turn coil over a saline half-space
analyzer. These data comprise the input impedance, Z W
in , of (10.4), but are not listed
here. The result of the computation is shown in Fig. 10.19. Note that there are two
resonances in the figure, one at about 260 MHz and the other at about 460 MHz.
These resonances are not present in the freespace probe response, so they are a
property of the saline, but we don’t yet know their origin.
10 Characterization of Atherosclerotic Lesions by Inversion of Eddy-. . .
Table 10.15 Y p for the
21.6 mm single-turn loop.
The frequency is in MHz
Freq.
Re
Im
59.000 7.68299869E-05 8.89377407E-05
61.250 6.22287553E-05 1.93887259E-04
63.500 2.16324188E-05 2.83220172E-04
65.750 4.39594660E-05 1.97137473E-04
68.000 1.19457676E-04 2.75384256E-04
482.00
1.71300489E-04 4.02158825E-03
484.25
1.64257421E-04 4.02043480E-03
486.50
1.66601327E-04 4.04098304E-03
488.75
1.59304051E-04 4.05691052E-03
491.00
1.54539463E-04 4.07911092E-03
493.25
1.56246097E-04 4.09630826E-03
495.50
1.56481488E-04 4.11793403E-03
497.75
1.59386982E-04 4.13913047E-03
500.00
1.57347269E-04 4.16233204E-03
21.6 mm
frequency = 50−500MHz
Single−Turn Coil
Saline: σ, ε
Fig. 10.18 Illustrating a single-turn coil over a saline half-space
analyzer. These data comprise the input impedance, Z W
in , of (10.4), but are not listed
here. The result of the computation is shown in Fig. 10.19. Note that there are two
resonances in the figure, one at about 260 MHz and the other at about 460 MHz.
These resonances are not present in the freespace probe response, so they are a
property of the saline, but we don’t yet know their origin.