

10.2 Sample Impedance Calculations
251
Table 10.1 Values for conductivity and permittivity for type Vb lesions. Values marked with a a
are inferred
Conductivity (S/m)
log 10 (Freq)
3
5
6
7
8
Blood
0.70
0.70
0.70
1.00
1.49
Fat
0.025
0.025
0.030
0.040
0.060
Muscle
0.40
0.40
0.40
0.40
0.75
Fibrous material
0.24
0.24
0.24
0.29 a
0.33 a
Calcium
0.08
0.08
0.10
0.12
0.17
Vessel wall
0.58
0.58
0.58
0.67 a
0.83 a
Relative permittivity
log 10 (Freq)
3
5
6
7
8
Blood
4100
4000
2000
300
75
Fat
20,000
100
50
30
12
Muscle
400,000
10,000
8000
200
70
Fibrous material
2000 a
500 a
50 a
5 a
3 a
Calcium
10,500
500
250
70
30
Vessel wall
100,000 a
5000 a
4000 a
100 a
30 a
Table 10.2 Thickness of
each layer in variations of a
type Vb lesion. The vessel
wall is assumed to be 0.3 mm
in all cases
Thickness of type Vb lesion layers (mm)
Calcium Fibrous SMC Lipid
Initial
0.1
0.3
0.3
1.0
Variation 1 0.2
0.2
0.2
1.1
Variation 2 0.2
0.2
0.5
0.8
Variation 3 0.1
0.5
0.3
0.8
Variation 4 0.1
0.1
0.7
0.8
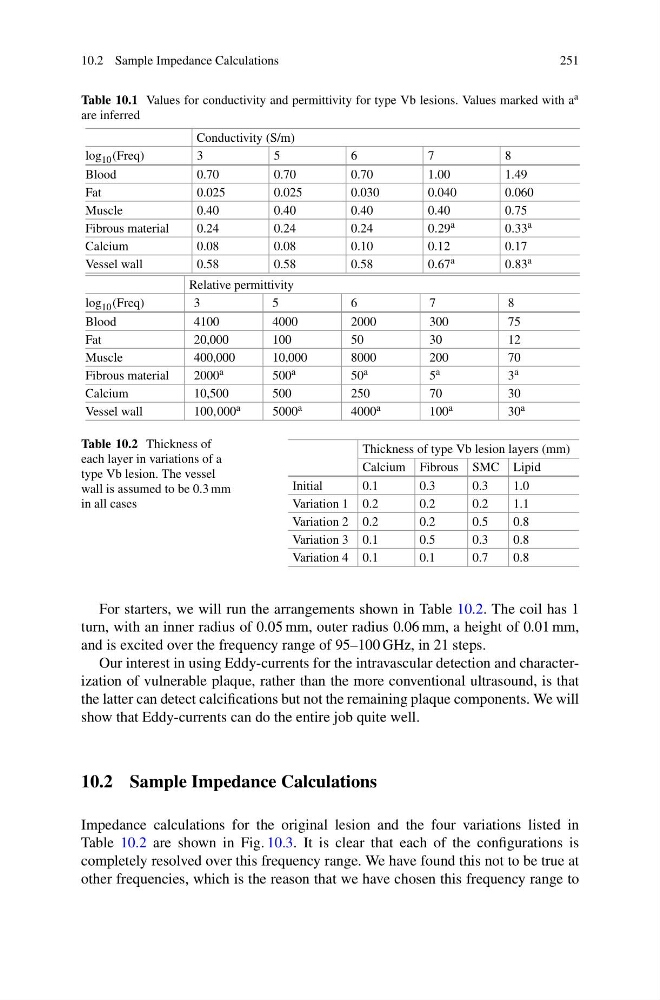
For starters, we will run the arrangements shown in Table 10.2. The coil has 1
turn, with an inner radius of 0.05 mm, outer radius 0.06 mm, a height of 0.01 mm,
and is excited over the frequency range of 95–100 GHz, in 21 steps.
Our interest in using Eddy-currents for the intravascular detection and characterization of vulnerable plaque, rather than the more conventional ultrasound, is that
the latter can detect calcifications but not the remaining plaque components. We will
show that Eddy-currents can do the entire job quite well.
10.2 Sample Impedance Calculations
Impedance calculations for the original lesion and the four variations listed in
Table 10.2 are shown in Fig. 10.3. It is clear that each of the configurations is
completely resolved over this frequency range. We have found this not to be true at
other frequencies, which is the reason that we have chosen this frequency range to
251
Table 10.1 Values for conductivity and permittivity for type Vb lesions. Values marked with a a
are inferred
Conductivity (S/m)
log 10 (Freq)
3
5
6
7
8
Blood
0.70
0.70
0.70
1.00
1.49
Fat
0.025
0.025
0.030
0.040
0.060
Muscle
0.40
0.40
0.40
0.40
0.75
Fibrous material
0.24
0.24
0.24
0.29 a
0.33 a
Calcium
0.08
0.08
0.10
0.12
0.17
Vessel wall
0.58
0.58
0.58
0.67 a
0.83 a
Relative permittivity
log 10 (Freq)
3
5
6
7
8
Blood
4100
4000
2000
300
75
Fat
20,000
100
50
30
12
Muscle
400,000
10,000
8000
200
70
Fibrous material
2000 a
500 a
50 a
5 a
3 a
Calcium
10,500
500
250
70
30
Vessel wall
100,000 a
5000 a
4000 a
100 a
30 a
Table 10.2 Thickness of
each layer in variations of a
type Vb lesion. The vessel
wall is assumed to be 0.3 mm
in all cases
Thickness of type Vb lesion layers (mm)
Calcium Fibrous SMC Lipid
Initial
0.1
0.3
0.3
1.0
Variation 1 0.2
0.2
0.2
1.1
Variation 2 0.2
0.2
0.5
0.8
Variation 3 0.1
0.5
0.3
0.8
Variation 4 0.1
0.1
0.7
0.8
For starters, we will run the arrangements shown in Table 10.2. The coil has 1
turn, with an inner radius of 0.05 mm, outer radius 0.06 mm, a height of 0.01 mm,
and is excited over the frequency range of 95–100 GHz, in 21 steps.
Our interest in using Eddy-currents for the intravascular detection and characterization of vulnerable plaque, rather than the more conventional ultrasound, is that
the latter can detect calcifications but not the remaining plaque components. We will
show that Eddy-currents can do the entire job quite well.
10.2 Sample Impedance Calculations
Impedance calculations for the original lesion and the four variations listed in
Table 10.2 are shown in Fig. 10.3. It is clear that each of the configurations is
completely resolved over this frequency range. We have found this not to be true at
other frequencies, which is the reason that we have chosen this frequency range to