

9.6 Results for 4D-Level 8
231
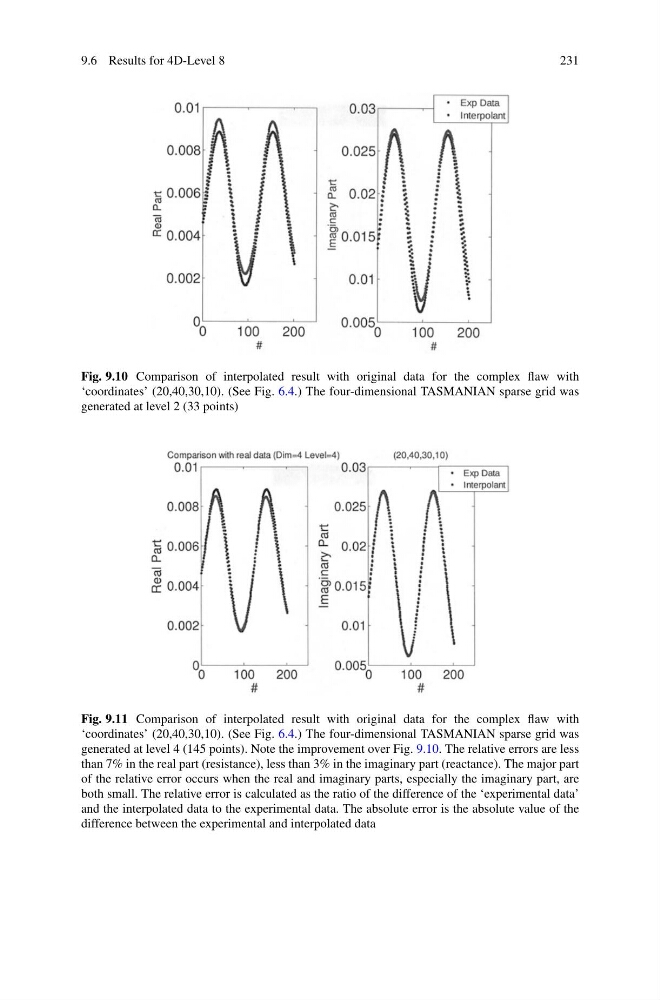
Fig. 9.10 Comparison of interpolated result with original data for the complex flaw with
‘coordinates’ (20,40,30,10). (See Fig. 6.4.) The four-dimensional TASMANIAN sparse grid was
generated at level 2 (33 points)
Fig. 9.11 Comparison of interpolated result with original data for the complex flaw with
‘coordinates’ (20,40,30,10). (See Fig. 6.4.) The four-dimensional TASMANIAN sparse grid was
generated at level 4 (145 points). Note the improvement over Fig. 9.10. The relative errors are less
than 7% in the real part (resistance), less than 3% in the imaginary part (reactance). The major part
of the relative error occurs when the real and imaginary parts, especially the imaginary part, are
both small. The relative error is calculated as the ratio of the difference of the ‘experimental data’
and the interpolated data to the experimental data. The absolute error is the absolute value of the
difference between the experimental and interpolated data
231
Fig. 9.10 Comparison of interpolated result with original data for the complex flaw with
‘coordinates’ (20,40,30,10). (See Fig. 6.4.) The four-dimensional TASMANIAN sparse grid was
generated at level 2 (33 points)
Fig. 9.11 Comparison of interpolated result with original data for the complex flaw with
‘coordinates’ (20,40,30,10). (See Fig. 6.4.) The four-dimensional TASMANIAN sparse grid was
generated at level 4 (145 points). Note the improvement over Fig. 9.10. The relative errors are less
than 7% in the real part (resistance), less than 3% in the imaginary part (reactance). The major part
of the relative error occurs when the real and imaginary parts, especially the imaginary part, are
both small. The relative error is calculated as the ratio of the difference of the ‘experimental data’
and the interpolated data to the experimental data. The absolute error is the absolute value of the
difference between the experimental and interpolated data