

208
8 A Model for Microstructure Characterization
Y
X
L
L
y
x
p=2
p=1
x’,y’
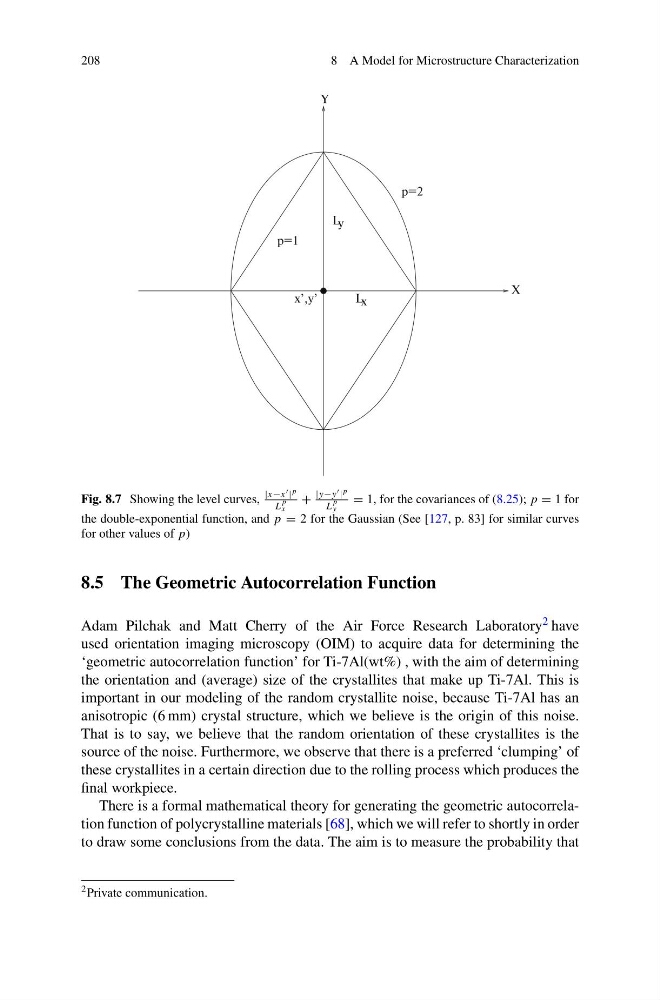
Fig. 8.7 Showing the level curves,
|x−x | p
L
p
x
+
|y−y | p
L
p
y
= 1, for the covariances of (8.25); p = 1 for
the double-exponential function, and p = 2 for the Gaussian (See [127, p. 83] for similar curves
for other values of p)
8.5 The Geometric Autocorrelation Function
Adam Pilchak and Matt Cherry of the Air Force Research Laboratory 2 have
used orientation imaging microscopy (OIM) to acquire data for determining the
‘geometric autocorrelation function’ for Ti-7Al(wt%) , with the aim of determining
the orientation and (average) size of the crystallites that make up Ti-7Al. This is
important in our modeling of the random crystallite noise, because Ti-7Al has an
anisotropic (6 mm) crystal structure, which we believe is the origin of this noise.
That is to say, we believe that the random orientation of these crystallites is the
source of the noise. Furthermore, we observe that there is a preferred ‘clumping’ of
these crystallites in a certain direction due to the rolling process which produces the
final workpiece.
There is a formal mathematical theory for generating the geometric autocorrelation function of polycrystalline materials [68], which we will refer to shortly in order
to draw some conclusions from the data. The aim is to measure the probability that
2 Private communication.
8 A Model for Microstructure Characterization
Y
X
L
L
y
x
p=2
p=1
x’,y’
Fig. 8.7 Showing the level curves,
|x−x | p
L
p
x
+
|y−y | p
L
p
y
= 1, for the covariances of (8.25); p = 1 for
the double-exponential function, and p = 2 for the Gaussian (See [127, p. 83] for similar curves
for other values of p)
8.5 The Geometric Autocorrelation Function
Adam Pilchak and Matt Cherry of the Air Force Research Laboratory 2 have
used orientation imaging microscopy (OIM) to acquire data for determining the
‘geometric autocorrelation function’ for Ti-7Al(wt%) , with the aim of determining
the orientation and (average) size of the crystallites that make up Ti-7Al. This is
important in our modeling of the random crystallite noise, because Ti-7Al has an
anisotropic (6 mm) crystal structure, which we believe is the origin of this noise.
That is to say, we believe that the random orientation of these crystallites is the
source of the noise. Furthermore, we observe that there is a preferred ‘clumping’ of
these crystallites in a certain direction due to the rolling process which produces the
final workpiece.
There is a formal mathematical theory for generating the geometric autocorrelation function of polycrystalline materials [68], which we will refer to shortly in order
to draw some conclusions from the data. The aim is to measure the probability that
2 Private communication.