

166
7 Integration of Functionals, PCM and Stochastic IntegralEquations
-200000
-150000
-100000
-50000
0
50000
100000
150000
200000
250000
300000
0
5
10
15
20
25
30
35
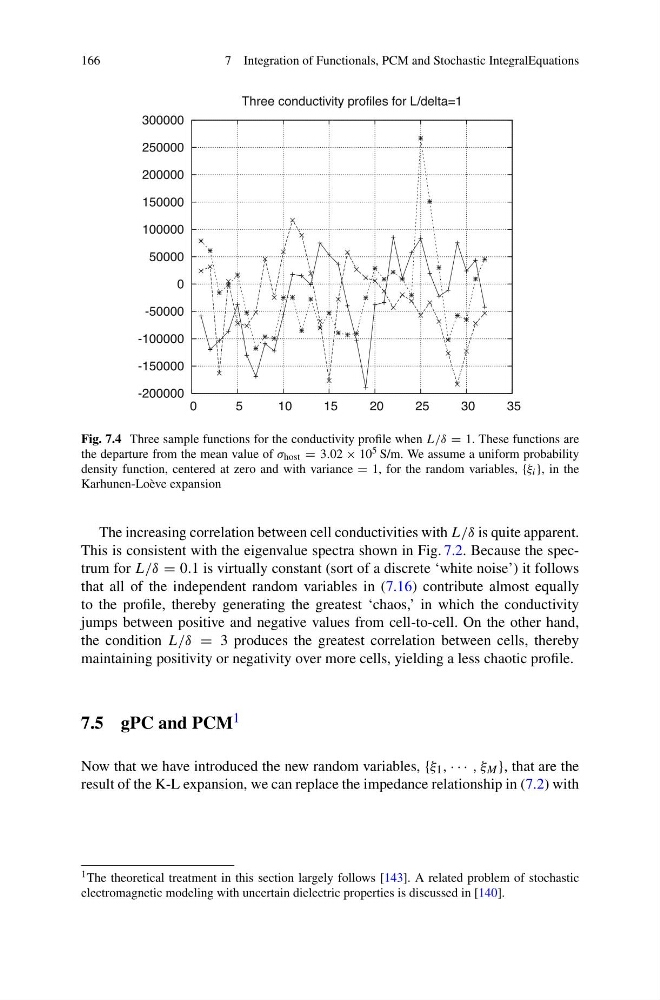
Three conductivity profiles for L/delta=1
Fig. 7.4 Three sample functions for the conductivity profile when L/δ = 1. These functions are
the departure from the mean value of σ host = 3.02 × 10 5 S/m. We assume a uniform probability
density function, centered at zero and with variance = 1, for the random variables, {ξ i }, in the
Karhunen-Loève expansion
The increasing correlation between cell conductivities with L/δ is quite apparent.
This is consistent with the eigenvalue spectra shown in Fig. 7.2. Because the spectrum for L/δ = 0.1 is virtually constant (sort of a discrete ‘white noise’) it follows
that all of the independent random variables in (7.16) contribute almost equally
to the profile, thereby generating the greatest ‘chaos,’ in which the conductivity
jumps between positive and negative values from cell-to-cell. On the other hand,
the condition L/δ = 3 produces the greatest correlation between cells, thereby
maintaining positivity or negativity over more cells, yielding a less chaotic profile.
7.5 gPC and PCM 1
Now that we have introduced the new random variables, {ξ 1 , · · · , ξ M }, that are the
result of the K-L expansion, we can replace the impedance relationship in (7.2) with
1 The theoretical treatment in this section largely follows [143]. A related problem of stochastic
electromagnetic modeling with uncertain dielectric properties is discussed in [140].
7 Integration of Functionals, PCM and Stochastic IntegralEquations
-200000
-150000
-100000
-50000
0
50000
100000
150000
200000
250000
300000
0
5
10
15
20
25
30
35
Three conductivity profiles for L/delta=1
Fig. 7.4 Three sample functions for the conductivity profile when L/δ = 1. These functions are
the departure from the mean value of σ host = 3.02 × 10 5 S/m. We assume a uniform probability
density function, centered at zero and with variance = 1, for the random variables, {ξ i }, in the
Karhunen-Loève expansion
The increasing correlation between cell conductivities with L/δ is quite apparent.
This is consistent with the eigenvalue spectra shown in Fig. 7.2. Because the spectrum for L/δ = 0.1 is virtually constant (sort of a discrete ‘white noise’) it follows
that all of the independent random variables in (7.16) contribute almost equally
to the profile, thereby generating the greatest ‘chaos,’ in which the conductivity
jumps between positive and negative values from cell-to-cell. On the other hand,
the condition L/δ = 3 produces the greatest correlation between cells, thereby
maintaining positivity or negativity over more cells, yielding a less chaotic profile.
7.5 gPC and PCM 1
Now that we have introduced the new random variables, {ξ 1 , · · · , ξ M }, that are the
result of the K-L expansion, we can replace the impedance relationship in (7.2) with
1 The theoretical treatment in this section largely follows [143]. A related problem of stochastic
electromagnetic modeling with uncertain dielectric properties is discussed in [140].