

4.7 Progress in Modeling Microstructure Quantification
119
-1.2x10
6
-1x10
6
-800000
-600000
-400000
-200000
0
200000
400000
600000
800000
1x10
6
-60 -50 -40 -30 -20 -10 0
10 20 30 40 50
Jx
Ex
Anomalous Conductivity for (k,l,m) = (3,3,3)
Real
Imag
Jx = 19900*Ex
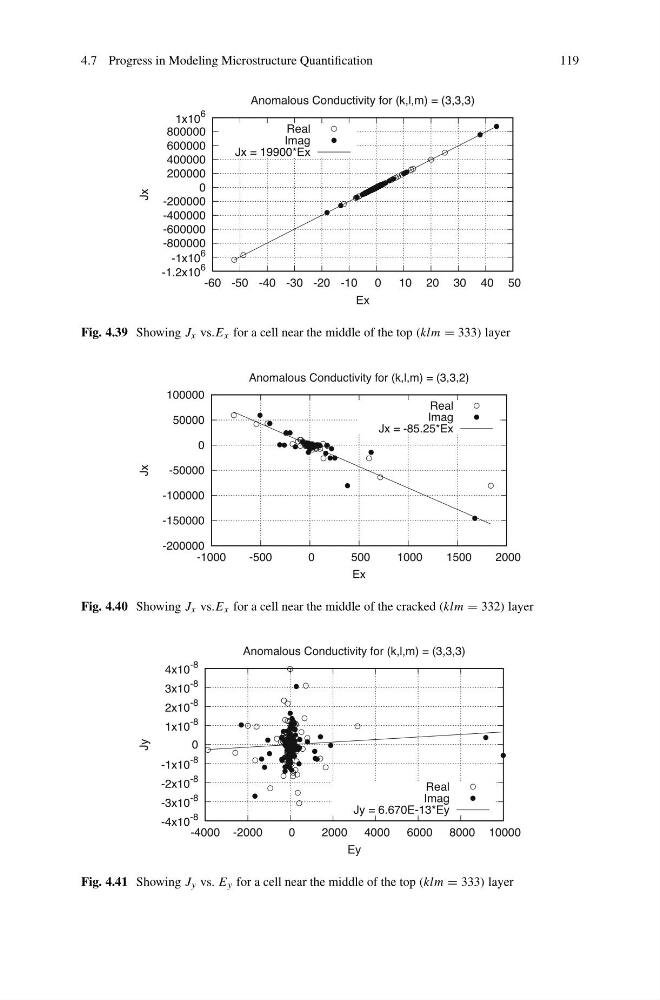
Fig. 4.39 Showing J x vs.E x for a cell near the middle of the top (klm = 333) layer
-200000
-150000
-100000
-50000
0
50000
100000
-1000
-500
0
500
1000
1500
2000
Jx
Ex
Anomalous Conductivity for (k,l,m) = (3,3,2)
Real
Imag
Jx = -85.25*Ex
Fig. 4.40 Showing J x vs.E x for a cell near the middle of the cracked (klm = 332) layer
-4x10
-8
-3x10
-8
-2x10
-8
-1x10
-8
0
1x10
-8
2x10
-8
3x10
-8
4x10
-8
-4000 -2000
0
2000 4000 6000 8000 10000
Jy
Ey
Anomalous Conductivity for (k,l,m) = (3,3,3)
Real
Imag
Jy = 6.670E-13*Ey
Fig. 4.41 Showing J y vs. E y for a cell near the middle of the top (klm = 333) layer
119
-1.2x10
6
-1x10
6
-800000
-600000
-400000
-200000
0
200000
400000
600000
800000
1x10
6
-60 -50 -40 -30 -20 -10 0
10 20 30 40 50
Jx
Ex
Anomalous Conductivity for (k,l,m) = (3,3,3)
Real
Imag
Jx = 19900*Ex
Fig. 4.39 Showing J x vs.E x for a cell near the middle of the top (klm = 333) layer
-200000
-150000
-100000
-50000
0
50000
100000
-1000
-500
0
500
1000
1500
2000
Jx
Ex
Anomalous Conductivity for (k,l,m) = (3,3,2)
Real
Imag
Jx = -85.25*Ex
Fig. 4.40 Showing J x vs.E x for a cell near the middle of the cracked (klm = 332) layer
-4x10
-8
-3x10
-8
-2x10
-8
-1x10
-8
0
1x10
-8
2x10
-8
3x10
-8
4x10
-8
-4000 -2000
0
2000 4000 6000 8000 10000
Jy
Ey
Anomalous Conductivity for (k,l,m) = (3,3,3)
Real
Imag
Jy = 6.670E-13*Ey
Fig. 4.41 Showing J y vs. E y for a cell near the middle of the top (klm = 333) layer