

4.4 Modeling Microstructure Quantification Problems
97
Table 4.2 Results of the model problem of Fig. 4.7
h, mm
R, Ohms
X, Ohms
Z, Ohms
Phase, Deg.
L, mH
0
0.043101
−0.013585
0.045191
−17.495
−2.1622E−7
0.007
0.042193
−0.012985
0.044146
−17.106
−2.0667E−7
0.014
0.041288
−0.012412
0.043113
−16.731
−1.9754E−7
0.021
0.04032
−0.011821
0.042017
−16.34
−1.8814E−7
500µm
0°
0°
90°
100 - 200 µm
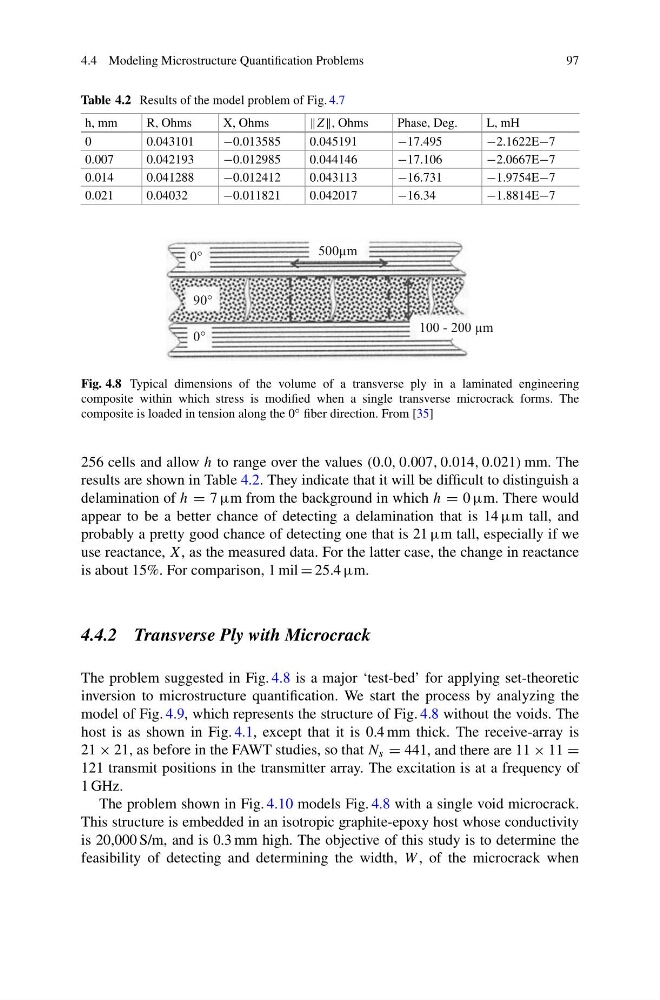
Fig. 4.8 Typical dimensions of the volume of a transverse ply in a laminated engineering
composite within which stress is modified when a single transverse microcrack forms. The
composite is loaded in tension along the 0 ◦ fiber direction. From [35]
256 cells and allow h to range over the values (0.0, 0.007, 0.014, 0.021) mm. The
results are shown in Table 4.2. They indicate that it will be difficult to distinguish a
delamination of h = 7 µm from the background in which h = 0 µm. There would
appear to be a better chance of detecting a delamination that is 14 µm tall, and
probably a pretty good chance of detecting one that is 21 µm tall, especially if we
use reactance, X, as the measured data. For the latter case, the change in reactance
is about 15%. For comparison, 1 mil = 25.4 µm.
4.4.2 Transverse Ply with Microcrack
The problem suggested in Fig. 4.8 is a major ‘test-bed’ for applying set-theoretic
inversion to microstructure quantification. We start the process by analyzing the
model of Fig. 4.9, which represents the structure of Fig. 4.8 without the voids. The
host is as shown in Fig. 4.1, except that it is 0.4 mm thick. The receive-array is
21 × 21, as before in the FAWT studies, so that N s = 441, and there are 11 × 11 =
121 transmit positions in the transmitter array. The excitation is at a frequency of
1 GHz.
The problem shown in Fig. 4.10 models Fig. 4.8 with a single void microcrack.
This structure is embedded in an isotropic graphite-epoxy host whose conductivity
is 20,000 S/m, and is 0.3 mm high. The objective of this study is to determine the
feasibility of detecting and determining the width, W , of the microcrack when
97
Table 4.2 Results of the model problem of Fig. 4.7
h, mm
R, Ohms
X, Ohms
Z, Ohms
Phase, Deg.
L, mH
0
0.043101
−0.013585
0.045191
−17.495
−2.1622E−7
0.007
0.042193
−0.012985
0.044146
−17.106
−2.0667E−7
0.014
0.041288
−0.012412
0.043113
−16.731
−1.9754E−7
0.021
0.04032
−0.011821
0.042017
−16.34
−1.8814E−7
500µm
0°
0°
90°
100 - 200 µm
Fig. 4.8 Typical dimensions of the volume of a transverse ply in a laminated engineering
composite within which stress is modified when a single transverse microcrack forms. The
composite is loaded in tension along the 0 ◦ fiber direction. From [35]
256 cells and allow h to range over the values (0.0, 0.007, 0.014, 0.021) mm. The
results are shown in Table 4.2. They indicate that it will be difficult to distinguish a
delamination of h = 7 µm from the background in which h = 0 µm. There would
appear to be a better chance of detecting a delamination that is 14 µm tall, and
probably a pretty good chance of detecting one that is 21 µm tall, especially if we
use reactance, X, as the measured data. For the latter case, the change in reactance
is about 15%. For comparison, 1 mil = 25.4 µm.
4.4.2 Transverse Ply with Microcrack
The problem suggested in Fig. 4.8 is a major ‘test-bed’ for applying set-theoretic
inversion to microstructure quantification. We start the process by analyzing the
model of Fig. 4.9, which represents the structure of Fig. 4.8 without the voids. The
host is as shown in Fig. 4.1, except that it is 0.4 mm thick. The receive-array is
21 × 21, as before in the FAWT studies, so that N s = 441, and there are 11 × 11 =
121 transmit positions in the transmitter array. The excitation is at a frequency of
1 GHz.
The problem shown in Fig. 4.10 models Fig. 4.8 with a single void microcrack.
This structure is embedded in an isotropic graphite-epoxy host whose conductivity
is 20,000 S/m, and is 0.3 mm high. The objective of this study is to determine the
feasibility of detecting and determining the width, W , of the microcrack when