

96
4 Application of the Set-Theoretic Algorithm to CFRP’s
4.3.3 Comment
In practice, we would not put receive sensors on the dense 21 × 21 grid suggested
in the model problems. They would be placed on a much sparser grid, and then
the dense data required would be generated by interpolation. This would also
hold for placement of the transmit sensors when they are placed over the entire
anomalous region. The idea is to use ‘sparse-grid’ methods to defeat the ‘curse of
dimensionality’ as described in Chap. 9.
4.4 Modeling Microstructure Quantification Problems
4.4.1 Delaminations
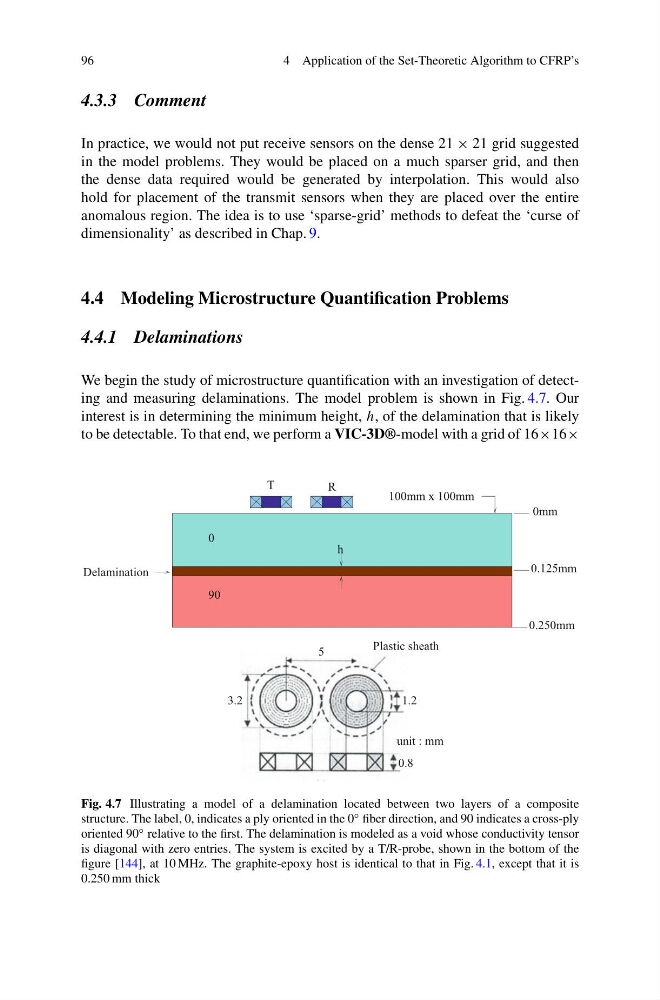
We begin the study of microstructure quantification with an investigation of detecting and measuring delaminations. The model problem is shown in Fig. 4.7. Our
interest is in determining the minimum height, h, of the delamination that is likely
to be detectable. To that end, we perform a VIC-3D®-model with a grid of 16×16×
100mm x 100mm
0mm
0.125mm
0.250mm
Plastic sheath
0.8
1.2
5
3.2
unit : mm
0
90
Delamination
T
R
h
Fig. 4.7 Illustrating a model of a delamination located between two layers of a composite
structure. The label, 0, indicates a ply oriented in the 0 ◦ fiber direction, and 90 indicates a cross-ply
oriented 90 ◦ relative to the first. The delamination is modeled as a void whose conductivity tensor
is diagonal with zero entries. The system is excited by a T/R-probe, shown in the bottom of the
figure [144], at 10 MHz. The graphite-epoxy host is identical to that in Fig. 4.1, except that it is
0.250 mm thick
4 Application of the Set-Theoretic Algorithm to CFRP’s
4.3.3 Comment
In practice, we would not put receive sensors on the dense 21 × 21 grid suggested
in the model problems. They would be placed on a much sparser grid, and then
the dense data required would be generated by interpolation. This would also
hold for placement of the transmit sensors when they are placed over the entire
anomalous region. The idea is to use ‘sparse-grid’ methods to defeat the ‘curse of
dimensionality’ as described in Chap. 9.
4.4 Modeling Microstructure Quantification Problems
4.4.1 Delaminations
We begin the study of microstructure quantification with an investigation of detecting and measuring delaminations. The model problem is shown in Fig. 4.7. Our
interest is in determining the minimum height, h, of the delamination that is likely
to be detectable. To that end, we perform a VIC-3D®-model with a grid of 16×16×
100mm x 100mm
0mm
0.125mm
0.250mm
Plastic sheath
0.8
1.2
5
3.2
unit : mm
0
90
Delamination
T
R
h
Fig. 4.7 Illustrating a model of a delamination located between two layers of a composite
structure. The label, 0, indicates a ply oriented in the 0 ◦ fiber direction, and 90 indicates a cross-ply
oriented 90 ◦ relative to the first. The delamination is modeled as a void whose conductivity tensor
is diagonal with zero entries. The system is excited by a T/R-probe, shown in the bottom of the
figure [144], at 10 MHz. The graphite-epoxy host is identical to that in Fig. 4.1, except that it is
0.250 mm thick