

155
The one-way ANOVA (analysis of variance) test further examines if a statistically significant difference exists between the group means. The assumptions for
this test require that the dependent variables are normally distributed and their variances homogenous. The recorded measurements do not fully satisfy the requirements of this test. Nonetheless, it is useful to present the groups means and their
variances to indicate the considerable differences in the three distributions (Table 3)
and how this reveals the Distant Horizon category (D) as being the preferred range
at the majority of sites. The Fit Distribution Tool of MATLAB (an interactive system for numerical computation) was also used to analyse D, this being the most
distinctive of the three classes of horizon range with culturally meaningful potential. That test failed to find any distribution, including the normal distribution, fitting
the data.
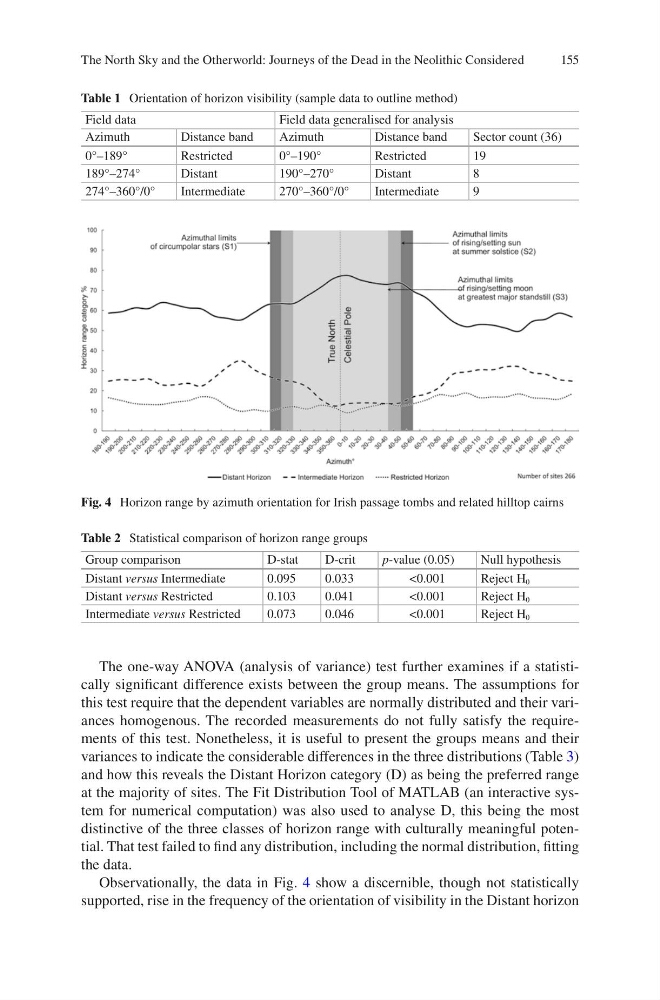
Observationally, the data in Fig. 4 show a discernible, though not statistically
supported, rise in the frequency of the orientation of visibility in the Distant horizon
Fig. 4 Horizon range by azimuth orientation for Irish passage tombs and related hilltop cairns
Table 1 Orientation of horizon visibility (sample data to outline method)
Field data
Field data generalised for analysis
Azimuth
Distance band
Azimuth
Distance band
Sector count (36)
0°–189°
Restricted
0°–190°
Restricted
19
189°–274°
Distant
190°–270°
Distant
8
274°–360°/0°
Intermediate
270°–360°/0°
Intermediate
9
Table 2 Statistical comparison of horizon range groups
Group comparison
D-stat
D-crit
p-value (0.05)
Null hypothesis
Distant versus Intermediate
0.095
0.033
<0.001
Reject H 0
Distant versus Restricted
0.103
0.041
<0.001
Reject H 0
Intermediate versus Restricted
0.073
0.046
<0.001
Reject H 0
The North Sky and the Otherworld: Journeys of the Dead in the Neolithic Considered
The one-way ANOVA (analysis of variance) test further examines if a statistically significant difference exists between the group means. The assumptions for
this test require that the dependent variables are normally distributed and their variances homogenous. The recorded measurements do not fully satisfy the requirements of this test. Nonetheless, it is useful to present the groups means and their
variances to indicate the considerable differences in the three distributions (Table 3)
and how this reveals the Distant Horizon category (D) as being the preferred range
at the majority of sites. The Fit Distribution Tool of MATLAB (an interactive system for numerical computation) was also used to analyse D, this being the most
distinctive of the three classes of horizon range with culturally meaningful potential. That test failed to find any distribution, including the normal distribution, fitting
the data.
Observationally, the data in Fig. 4 show a discernible, though not statistically
supported, rise in the frequency of the orientation of visibility in the Distant horizon
Fig. 4 Horizon range by azimuth orientation for Irish passage tombs and related hilltop cairns
Table 1 Orientation of horizon visibility (sample data to outline method)
Field data
Field data generalised for analysis
Azimuth
Distance band
Azimuth
Distance band
Sector count (36)
0°–189°
Restricted
0°–190°
Restricted
19
189°–274°
Distant
190°–270°
Distant
8
274°–360°/0°
Intermediate
270°–360°/0°
Intermediate
9
Table 2 Statistical comparison of horizon range groups
Group comparison
D-stat
D-crit
p-value (0.05)
Null hypothesis
Distant versus Intermediate
0.095
0.033
<0.001
Reject H 0
Distant versus Restricted
0.103
0.041
<0.001
Reject H 0
Intermediate versus Restricted
0.073
0.046
<0.001
Reject H 0
The North Sky and the Otherworld: Journeys of the Dead in the Neolithic Considered