

3.4 Experimental Implementation of RP-THz-TDS
65
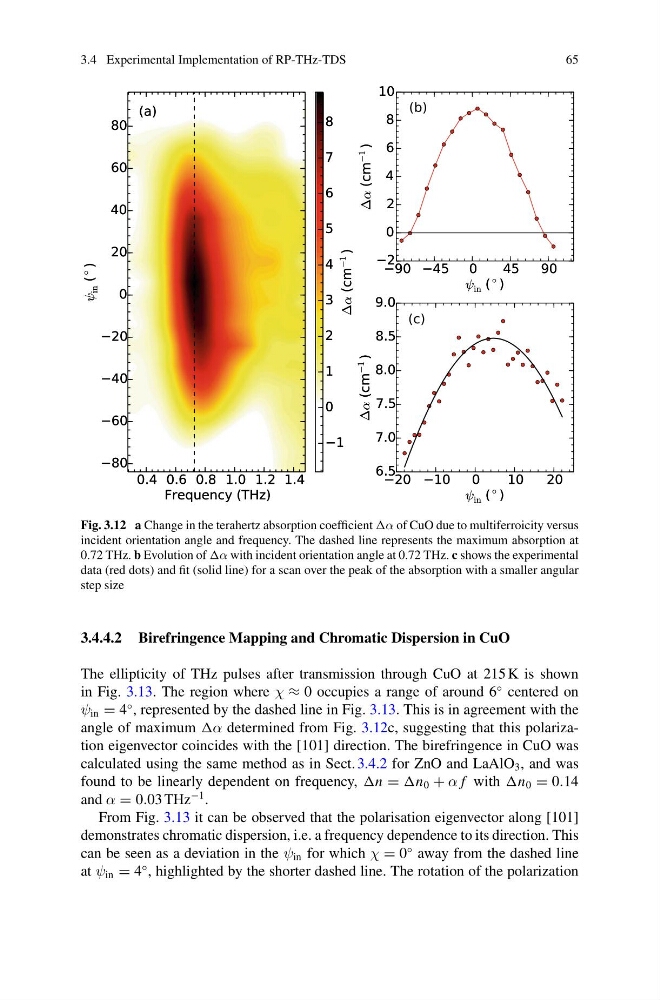
Fig. 3.12 a Change in the terahertz absorption coefficient of CuO due to multiferroicity versus
incident orientation angle and frequency. The dashed line represents the maximum absorption at
0.72 THz. b Evolution of with incident orientation angle at 0.72 THz. c shows the experimental
data (red dots) and fit (solid line) for a scan over the peak of the absorption with a smaller angular
step size
3.4.4.2 Birefringence Mapping and Chromatic Dispersion in CuO
The ellipticity of THz pulses after transmission through CuO at 215 K is shown
in Fig. 3.13. The region where χ ≈ 0 occupies a range of around 6
◦ centered on
ψ in = 4
◦ , represented by the dashed line in Fig. 3.13. This is in agreement with the
angle of maximum determined from Fig. 3.12c, suggesting that this polarization eigenvector coincides with the [101] direction. The birefringence in CuO was
calculated using the same method as in Sect. 3.4.2 for ZnO and LaAlO 3 , and was
found to be linearly dependent on frequency, = 0 + α f with 0 = 0.14
and α = 0.03 THz
−1 .
From Fig. 3.13 it can be observed that the polarisation eigenvector along [101]
demonstrates chromatic dispersion, i.e. a frequency dependence to its direction. This
can be seen as a deviation in the ψ in for which χ = 0
◦ away from the dashed line
at ψ in = 4
◦ , highlighted by the shorter dashed line. The rotation of the polarization
65
Fig. 3.12 a Change in the terahertz absorption coefficient of CuO due to multiferroicity versus
incident orientation angle and frequency. The dashed line represents the maximum absorption at
0.72 THz. b Evolution of with incident orientation angle at 0.72 THz. c shows the experimental
data (red dots) and fit (solid line) for a scan over the peak of the absorption with a smaller angular
step size
3.4.4.2 Birefringence Mapping and Chromatic Dispersion in CuO
The ellipticity of THz pulses after transmission through CuO at 215 K is shown
in Fig. 3.13. The region where χ ≈ 0 occupies a range of around 6
◦ centered on
ψ in = 4
◦ , represented by the dashed line in Fig. 3.13. This is in agreement with the
angle of maximum determined from Fig. 3.12c, suggesting that this polarization eigenvector coincides with the [101] direction. The birefringence in CuO was
calculated using the same method as in Sect. 3.4.2 for ZnO and LaAlO 3 , and was
found to be linearly dependent on frequency, = 0 + α f with 0 = 0.14
and α = 0.03 THz
−1 .
From Fig. 3.13 it can be observed that the polarisation eigenvector along [101]
demonstrates chromatic dispersion, i.e. a frequency dependence to its direction. This
can be seen as a deviation in the ψ in for which χ = 0
◦ away from the dashed line
at ψ in = 4
◦ , highlighted by the shorter dashed line. The rotation of the polarization