

20
1 Introduction
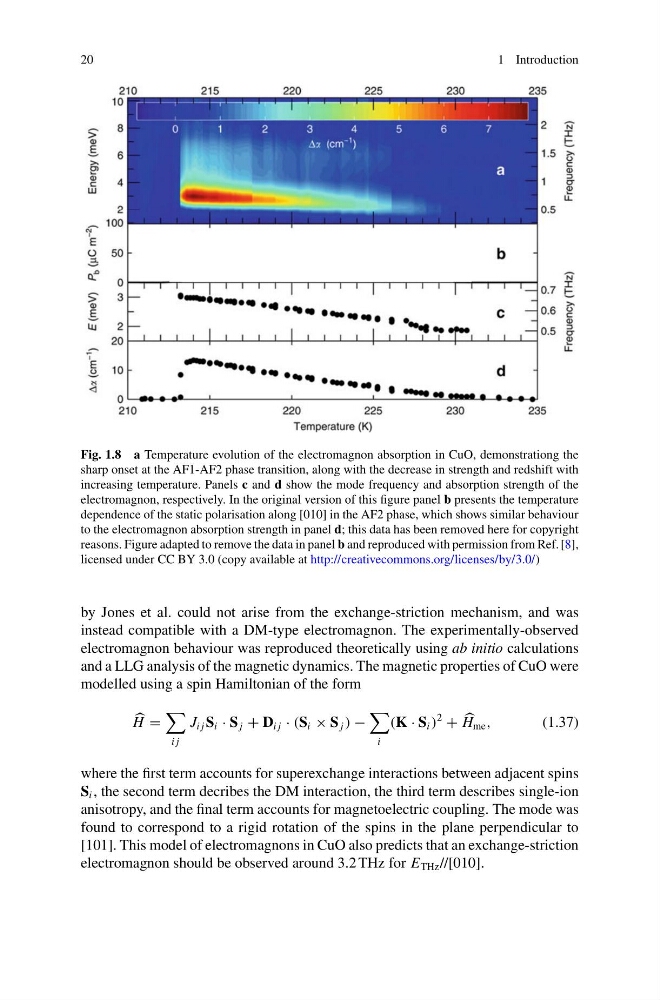
Fig. 1.8 a Temperature evolution of the electromagnon absorption in CuO, demonstrationg the
sharp onset at the AF1-AF2 phase transition, along with the decrease in strength and redshift with
increasing temperature. Panels c and d show the mode frequency and absorption strength of the
electromagnon, respectively. In the original version of this figure panel b presents the temperature
dependence of the static polarisation along [010] in the AF2 phase, which shows similar behaviour
to the electromagnon absorption strength in panel d; this data has been removed here for copyright
reasons. Figure adapted to remove the data in panel b and reproduced with permission from Ref. [8],
licensed under CC BY 3.0 (copy available at http://creativecommons.org/licenses/by/3.0/)
by Jones et al. could not arise from the exchange-striction mechanism, and was
instead compatible with a DM-type electromagnon. The experimentally-observed
electromagnon behaviour was reproduced theoretically using ab initio calculations
and a LLG analysis of the magnetic dynamics. The magnetic properties of CuO were
modelled using a spin Hamiltonian of the form
H =
i j
J i j S i · S j + D i j · (S i × S j ) −
i
(K · S i )
2
+
H me ,
(1.37)
where the first term accounts for superexchange interactions between adjacent spins
S i , the second term decribes the DM interaction, the third term describes single-ion
anisotropy, and the final term accounts for magnetoelectric coupling. The mode was
found to correspond to a rigid rotation of the spins in the plane perpendicular to
[101]. This model of electromagnons in CuO also predicts that an exchange-striction
electromagnon should be observed around 3.2 THz for E THz //[010].
1 Introduction
Fig. 1.8 a Temperature evolution of the electromagnon absorption in CuO, demonstrationg the
sharp onset at the AF1-AF2 phase transition, along with the decrease in strength and redshift with
increasing temperature. Panels c and d show the mode frequency and absorption strength of the
electromagnon, respectively. In the original version of this figure panel b presents the temperature
dependence of the static polarisation along [010] in the AF2 phase, which shows similar behaviour
to the electromagnon absorption strength in panel d; this data has been removed here for copyright
reasons. Figure adapted to remove the data in panel b and reproduced with permission from Ref. [8],
licensed under CC BY 3.0 (copy available at http://creativecommons.org/licenses/by/3.0/)
by Jones et al. could not arise from the exchange-striction mechanism, and was
instead compatible with a DM-type electromagnon. The experimentally-observed
electromagnon behaviour was reproduced theoretically using ab initio calculations
and a LLG analysis of the magnetic dynamics. The magnetic properties of CuO were
modelled using a spin Hamiltonian of the form
H =
i j
J i j S i · S j + D i j · (S i × S j ) −
i
(K · S i )
2
+
H me ,
(1.37)
where the first term accounts for superexchange interactions between adjacent spins
S i , the second term decribes the DM interaction, the third term describes single-ion
anisotropy, and the final term accounts for magnetoelectric coupling. The mode was
found to correspond to a rigid rotation of the spins in the plane perpendicular to
[101]. This model of electromagnons in CuO also predicts that an exchange-striction
electromagnon should be observed around 3.2 THz for E THz //[010].