

1.3 Electromagnons in Improper Ferroelectrics
19
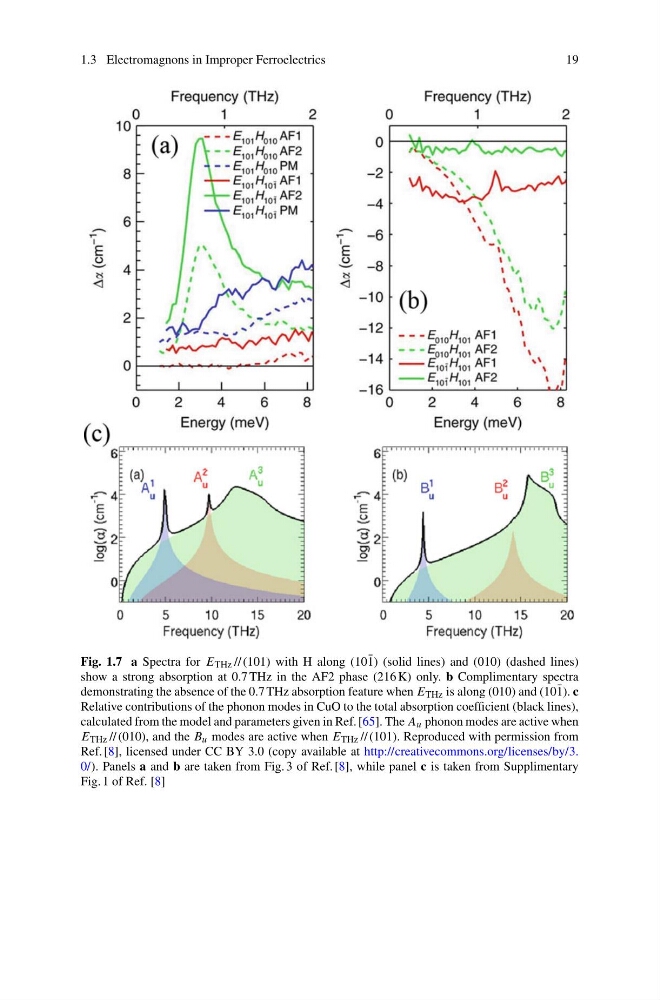
Fig. 1.7 a Spectra for E THz // (101) with H along (10 ¯
1) (solid lines) and (010) (dashed lines)
show a strong absorption at 0.7 THz in the AF2 phase (216 K) only. b Complimentary spectra
demonstrating the absence of the 0.7 THz absorption feature when E THz is along (010) and (10 ¯
1). c
Relative contributions of the phonon modes in CuO to the total absorption coefficient (black lines),
calculated from the model and parameters given in Ref. [65]. The A u phonon modes are active when
E THz // (010), and the B u modes are active when E THz // (101). Reproduced with permission from
Ref. [8], licensed under CC BY 3.0 (copy available at http://creativecommons.org/licenses/by/3.
0/). Panels a and b are taken from Fig. 3 of Ref. [8], while panel c is taken from Supplimentary
Fig. 1 of Ref. [8]
19
Fig. 1.7 a Spectra for E THz // (101) with H along (10 ¯
1) (solid lines) and (010) (dashed lines)
show a strong absorption at 0.7 THz in the AF2 phase (216 K) only. b Complimentary spectra
demonstrating the absence of the 0.7 THz absorption feature when E THz is along (010) and (10 ¯
1). c
Relative contributions of the phonon modes in CuO to the total absorption coefficient (black lines),
calculated from the model and parameters given in Ref. [65]. The A u phonon modes are active when
E THz // (010), and the B u modes are active when E THz // (101). Reproduced with permission from
Ref. [8], licensed under CC BY 3.0 (copy available at http://creativecommons.org/licenses/by/3.
0/). Panels a and b are taken from Fig. 3 of Ref. [8], while panel c is taken from Supplimentary
Fig. 1 of Ref. [8]