

which is about +0.48 Wm
−2 ; Stocker et al. 2013). The
pre-industrial CH 4 concentration has been estimated as
700 ppb, but increased anthropogenic activities, such as the
agricultural practices and industrial activities, have resulted
in a steady increase of atmospheric CH 4 , up to 1803 ppb in
2011 (Dlugokencky et al. 2011; Etheridge et al. 1998). It
also plays an active role in tropospheric chemistry. CH 4 is
mainly lost by reaction with the OH radical, and hence it
directly contributes to stratospheric water vapor increase
(Keppler et al. 2006). CH 4 emissions from the anthropogenic
sources in India have grown from 18.85 to 20.56 Tg yr
−1
during 1985–2008 (Garg et al. 2011). Patra et al. (2013)
made a comprehensive analysis to estimate CH 4 emission
from the entire South Asian region which turned out to be
37 ± 3.7 TgC-CH 4 yr
−1 during the 2000s. Unlike CO 2 ,
CH 4 has a relatively short lifetime of 9–10 years. Shorter
lifetime, compared to CO 2 , N 2 O or CFCs, is potentially
useful for its sources and sinks to achieve a steady state or
even a decline, thus reducing its impact on global climate
change. A quasi-steady state was observed in the late 1990s
and the first half of the 2000s (Dlugokencky et al. 2011). But
increased emission of CH 4 , driven by the anthropogenic
activities, later perturbed the equilibrium state (Rigby et al.
2008; Patra et al. 2016). The source and sink mechanism of
CH 4 is complex, and several components of its budget
remain poorly constrained. Surface observation of CH 4 in
India is limited to a very few places, and those too provide
only sporadic data; long time measurement is mostly absent.
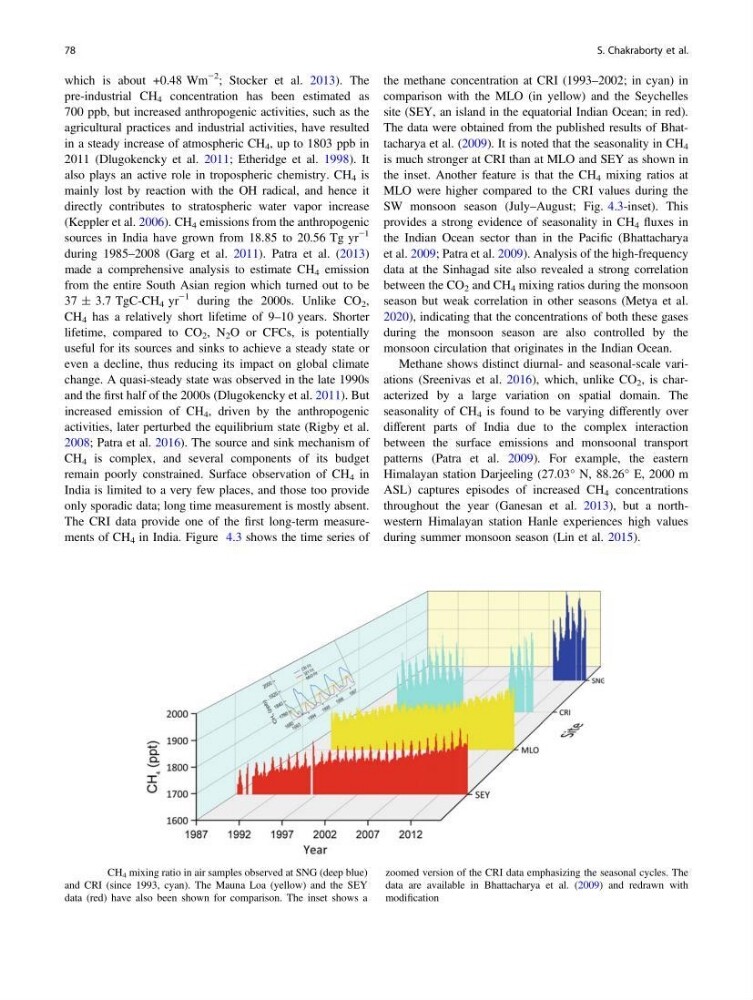
The CRI data provide one of the first long-term measurements of CH 4 in India. Figure 4.3 shows the time series of
the methane concentration at CRI (1993–2002; in cyan) in
comparison with the MLO (in yellow) and the Seychelles
site (SEY, an island in the equatorial Indian Ocean; in red).
The data were obtained from the published results of Bhattacharya et al. (2009). It is noted that the seasonality in CH 4
is much stronger at CRI than at MLO and SEY as shown in
the inset. Another feature is that the CH 4 mixing ratios at
MLO were higher compared to the CRI values during the
SW monsoon season (July–August; Fig. 4.3-inset). This
provides a strong evidence of seasonality in CH 4 fluxes in
the Indian Ocean sector than in the Pacific (Bhattacharya
et al. 2009; Patra et al. 2009). Analysis of the high-frequency
data at the Sinhagad site also revealed a strong correlation
between the CO 2 and CH 4 mixing ratios during the monsoon
season but weak correlation in other seasons (Metya et al.
2020), indicating that the concentrations of both these gases
during the monsoon season are also controlled by the
monsoon circulation that originates in the Indian Ocean.
Methane shows distinct diurnal- and seasonal-scale variations (Sreenivas et al. 2016), which, unlike CO 2 , is characterized by a large variation on spatial domain. The
seasonality of CH 4 is found to be varying differently over
different parts of India due to the complex interaction
between the surface emissions and monsoonal transport
patterns (Patra et al. 2009). For example, the eastern
Himalayan station Darjeeling (27.03° N, 88.26° E, 2000 m
ASL) captures episodes of increased CH 4 concentrations
throughout the year (Ganesan et al. 2013), but a northwestern Himalayan station Hanle experiences high values
during summer monsoon season (Lin et al. 2015).
Fig. 4.3 CH 4 mixing ratio in air samples observed at SNG (deep blue)
and CRI (since 1993, cyan). The Mauna Loa (yellow) and the SEY
data (red) have also been shown for comparison. The inset shows a
zoomed version of the CRI data emphasizing the seasonal cycles. The
data are available in Bhattacharya et al. (2009) and redrawn with
modification
78
S. Chakraborty et al.
−2 ; Stocker et al. 2013). The
pre-industrial CH 4 concentration has been estimated as
700 ppb, but increased anthropogenic activities, such as the
agricultural practices and industrial activities, have resulted
in a steady increase of atmospheric CH 4 , up to 1803 ppb in
2011 (Dlugokencky et al. 2011; Etheridge et al. 1998). It
also plays an active role in tropospheric chemistry. CH 4 is
mainly lost by reaction with the OH radical, and hence it
directly contributes to stratospheric water vapor increase
(Keppler et al. 2006). CH 4 emissions from the anthropogenic
sources in India have grown from 18.85 to 20.56 Tg yr
−1
during 1985–2008 (Garg et al. 2011). Patra et al. (2013)
made a comprehensive analysis to estimate CH 4 emission
from the entire South Asian region which turned out to be
37 ± 3.7 TgC-CH 4 yr
−1 during the 2000s. Unlike CO 2 ,
CH 4 has a relatively short lifetime of 9–10 years. Shorter
lifetime, compared to CO 2 , N 2 O or CFCs, is potentially
useful for its sources and sinks to achieve a steady state or
even a decline, thus reducing its impact on global climate
change. A quasi-steady state was observed in the late 1990s
and the first half of the 2000s (Dlugokencky et al. 2011). But
increased emission of CH 4 , driven by the anthropogenic
activities, later perturbed the equilibrium state (Rigby et al.
2008; Patra et al. 2016). The source and sink mechanism of
CH 4 is complex, and several components of its budget
remain poorly constrained. Surface observation of CH 4 in
India is limited to a very few places, and those too provide
only sporadic data; long time measurement is mostly absent.
The CRI data provide one of the first long-term measurements of CH 4 in India. Figure 4.3 shows the time series of
the methane concentration at CRI (1993–2002; in cyan) in
comparison with the MLO (in yellow) and the Seychelles
site (SEY, an island in the equatorial Indian Ocean; in red).
The data were obtained from the published results of Bhattacharya et al. (2009). It is noted that the seasonality in CH 4
is much stronger at CRI than at MLO and SEY as shown in
the inset. Another feature is that the CH 4 mixing ratios at
MLO were higher compared to the CRI values during the
SW monsoon season (July–August; Fig. 4.3-inset). This
provides a strong evidence of seasonality in CH 4 fluxes in
the Indian Ocean sector than in the Pacific (Bhattacharya
et al. 2009; Patra et al. 2009). Analysis of the high-frequency
data at the Sinhagad site also revealed a strong correlation
between the CO 2 and CH 4 mixing ratios during the monsoon
season but weak correlation in other seasons (Metya et al.
2020), indicating that the concentrations of both these gases
during the monsoon season are also controlled by the
monsoon circulation that originates in the Indian Ocean.
Methane shows distinct diurnal- and seasonal-scale variations (Sreenivas et al. 2016), which, unlike CO 2 , is characterized by a large variation on spatial domain. The
seasonality of CH 4 is found to be varying differently over
different parts of India due to the complex interaction
between the surface emissions and monsoonal transport
patterns (Patra et al. 2009). For example, the eastern
Himalayan station Darjeeling (27.03° N, 88.26° E, 2000 m
ASL) captures episodes of increased CH 4 concentrations
throughout the year (Ganesan et al. 2013), but a northwestern Himalayan station Hanle experiences high values
during summer monsoon season (Lin et al. 2015).
Fig. 4.3 CH 4 mixing ratio in air samples observed at SNG (deep blue)
and CRI (since 1993, cyan). The Mauna Loa (yellow) and the SEY
data (red) have also been shown for comparison. The inset shows a
zoomed version of the CRI data emphasizing the seasonal cycles. The
data are available in Bhattacharya et al. (2009) and redrawn with
modification
78
S. Chakraborty et al.