

Change Detection and Indices (ETCCDI), computed with a
consistent methodology for climate change simulations for
different emission scenarios are discussed below.
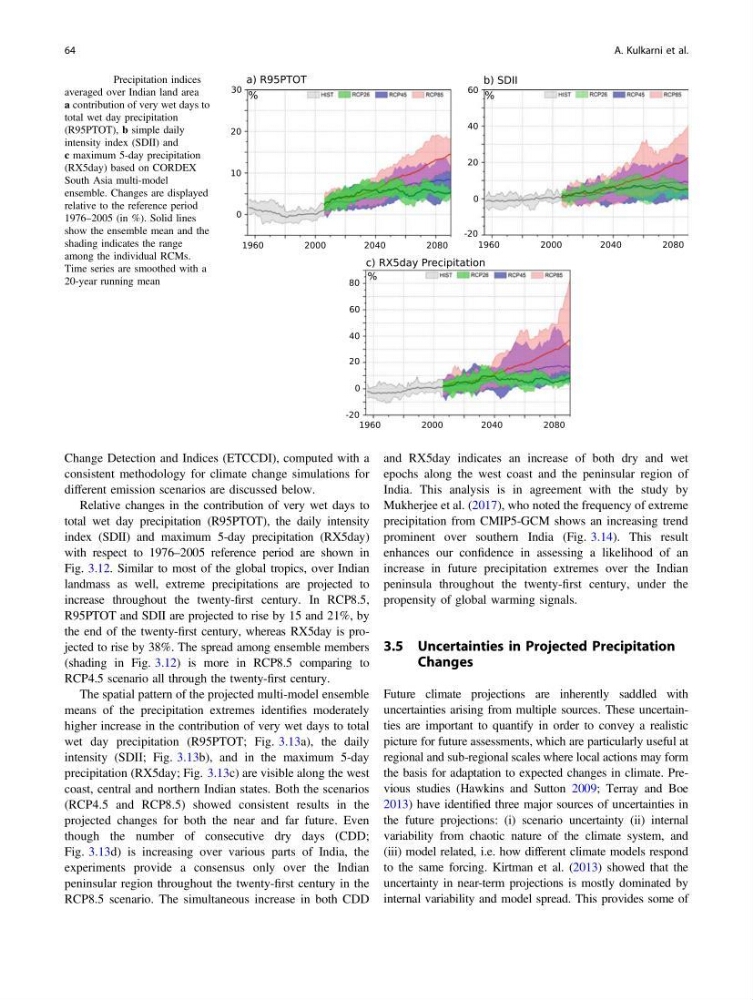
Relative changes in the contribution of very wet days to
total wet day precipitation (R95PTOT), the daily intensity
index (SDII) and maximum 5-day precipitation (RX5day)
with respect to 1976–2005 reference period are shown in
Fig. 3.12. Similar to most of the global tropics, over Indian
landmass as well, extreme precipitations are projected to
increase throughout the twenty-first century. In RCP8.5,
R95PTOT and SDII are projected to rise by 15 and 21%, by
the end of the twenty-first century, whereas RX5day is projected to rise by 38%. The spread among ensemble members
(shading in Fig. 3.12) is more in RCP8.5 comparing to
RCP4.5 scenario all through the twenty-first century.
The spatial pattern of the projected multi-model ensemble
means of the precipitation extremes identifies moderately
higher increase in the contribution of very wet days to total
wet day precipitation (R95PTOT; Fig. 3.13a), the daily
intensity (SDII; Fig. 3.13b), and in the maximum 5-day
precipitation (RX5day; Fig. 3.13c) are visible along the west
coast, central and northern Indian states. Both the scenarios
(RCP4.5 and RCP8.5) showed consistent results in the
projected changes for both the near and far future. Even
though the number of consecutive dry days (CDD;
Fig. 3.13d) is increasing over various parts of India, the
experiments provide a consensus only over the Indian
peninsular region throughout the twenty-first century in the
RCP8.5 scenario. The simultaneous increase in both CDD
and RX5day indicates an increase of both dry and wet
epochs along the west coast and the peninsular region of
India. This analysis is in agreement with the study by
Mukherjee et al. (2017), who noted the frequency of extreme
precipitation from CMIP5-GCM shows an increasing trend
prominent over southern India (Fig. 3.14). This result
enhances our confidence in assessing a likelihood of an
increase in future precipitation extremes over the Indian
peninsula throughout the twenty-first century, under the
propensity of global warming signals.
3.5 Uncertainties in Projected Precipitation
Changes
Future climate projections are inherently saddled with
uncertainties arising from multiple sources. These uncertainties are important to quantify in order to convey a realistic
picture for future assessments, which are particularly useful at
regional and sub-regional scales where local actions may form
the basis for adaptation to expected changes in climate. Previous studies (Hawkins and Sutton 2009; Terray and Boe
2013) have identified three major sources of uncertainties in
the future projections: (i) scenario uncertainty (ii) internal
variability from chaotic nature of the climate system, and
(iii) model related, i.e. how different climate models respond
to the same forcing. Kirtman et al. (2013) showed that the
uncertainty in near-term projections is mostly dominated by
internal variability and model spread. This provides some of
Fig. 3.12 Precipitation indices
averaged over Indian land area
a contribution of very wet days to
total wet day precipitation
(R95PTOT), b simple daily
intensity index (SDII) and
c maximum 5-day precipitation
(RX5day) based on CORDEX
South Asia multi-model
ensemble. Changes are displayed
relative to the reference period
1976–2005 (in %). Solid lines
show the ensemble mean and the
shading indicates the range
among the individual RCMs.
Time series are smoothed with a
20-year running mean
64
A. Kulkarni et al.
consistent methodology for climate change simulations for
different emission scenarios are discussed below.
Relative changes in the contribution of very wet days to
total wet day precipitation (R95PTOT), the daily intensity
index (SDII) and maximum 5-day precipitation (RX5day)
with respect to 1976–2005 reference period are shown in
Fig. 3.12. Similar to most of the global tropics, over Indian
landmass as well, extreme precipitations are projected to
increase throughout the twenty-first century. In RCP8.5,
R95PTOT and SDII are projected to rise by 15 and 21%, by
the end of the twenty-first century, whereas RX5day is projected to rise by 38%. The spread among ensemble members
(shading in Fig. 3.12) is more in RCP8.5 comparing to
RCP4.5 scenario all through the twenty-first century.
The spatial pattern of the projected multi-model ensemble
means of the precipitation extremes identifies moderately
higher increase in the contribution of very wet days to total
wet day precipitation (R95PTOT; Fig. 3.13a), the daily
intensity (SDII; Fig. 3.13b), and in the maximum 5-day
precipitation (RX5day; Fig. 3.13c) are visible along the west
coast, central and northern Indian states. Both the scenarios
(RCP4.5 and RCP8.5) showed consistent results in the
projected changes for both the near and far future. Even
though the number of consecutive dry days (CDD;
Fig. 3.13d) is increasing over various parts of India, the
experiments provide a consensus only over the Indian
peninsular region throughout the twenty-first century in the
RCP8.5 scenario. The simultaneous increase in both CDD
and RX5day indicates an increase of both dry and wet
epochs along the west coast and the peninsular region of
India. This analysis is in agreement with the study by
Mukherjee et al. (2017), who noted the frequency of extreme
precipitation from CMIP5-GCM shows an increasing trend
prominent over southern India (Fig. 3.14). This result
enhances our confidence in assessing a likelihood of an
increase in future precipitation extremes over the Indian
peninsula throughout the twenty-first century, under the
propensity of global warming signals.
3.5 Uncertainties in Projected Precipitation
Changes
Future climate projections are inherently saddled with
uncertainties arising from multiple sources. These uncertainties are important to quantify in order to convey a realistic
picture for future assessments, which are particularly useful at
regional and sub-regional scales where local actions may form
the basis for adaptation to expected changes in climate. Previous studies (Hawkins and Sutton 2009; Terray and Boe
2013) have identified three major sources of uncertainties in
the future projections: (i) scenario uncertainty (ii) internal
variability from chaotic nature of the climate system, and
(iii) model related, i.e. how different climate models respond
to the same forcing. Kirtman et al. (2013) showed that the
uncertainty in near-term projections is mostly dominated by
internal variability and model spread. This provides some of
Fig. 3.12 Precipitation indices
averaged over Indian land area
a contribution of very wet days to
total wet day precipitation
(R95PTOT), b simple daily
intensity index (SDII) and
c maximum 5-day precipitation
(RX5day) based on CORDEX
South Asia multi-model
ensemble. Changes are displayed
relative to the reference period
1976–2005 (in %). Solid lines
show the ensemble mean and the
shading indicates the range
among the individual RCMs.
Time series are smoothed with a
20-year running mean
64
A. Kulkarni et al.