

scenario; however, both projections (RCP4.5 and RCP8.5)
shows an increase in precipitation [CMIP5 (10–20%),
CORDEX (10–25%) and NEX (15–35%)] by the end of the
twenty-first century.
3.4 Changes in Daily Precipitation Extremes
3.4.1 Observed Changes and Their Attribution
Detecting changes in the characteristics of extreme rain
events is an important issue in view of their large impacts on
human society (Ghosh et al. 2016). It is difficult to attribute a
specific extreme event during the monsoon is owing to
anthropogenic climate change—like the Uttarakhand surges
of 2015, or recent flood in Kerala during 2018 monsoon—
yet it is robustly anticipated that a warming atmosphere will
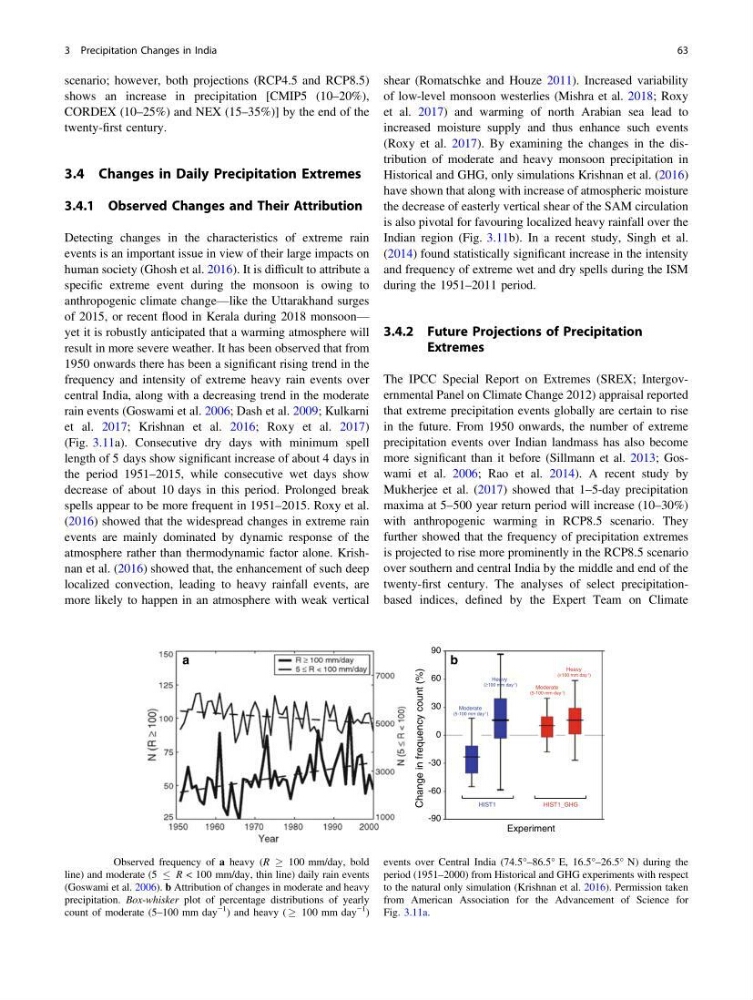
result in more severe weather. It has been observed that from
1950 onwards there has been a significant rising trend in the
frequency and intensity of extreme heavy rain events over
central India, along with a decreasing trend in the moderate
rain events (Goswami et al. 2006; Dash et al. 2009; Kulkarni
et al. 2017; Krishnan et al. 2016; Roxy et al. 2017)
(Fig. 3.11a). Consecutive dry days with minimum spell
length of 5 days show significant increase of about 4 days in
the period 1951–2015, while consecutive wet days show
decrease of about 10 days in this period. Prolonged break
spells appear to be more frequent in 1951–2015. Roxy et al.
(2016) showed that the widespread changes in extreme rain
events are mainly dominated by dynamic response of the
atmosphere rather than thermodynamic factor alone. Krishnan et al. (2016) showed that, the enhancement of such deep
localized convection, leading to heavy rainfall events, are
more likely to happen in an atmosphere with weak vertical
shear (Romatschke and Houze 2011). Increased variability
of low-level monsoon westerlies (Mishra et al. 2018; Roxy
et al. 2017) and warming of north Arabian sea lead to
increased moisture supply and thus enhance such events
(Roxy et al. 2017). By examining the changes in the distribution of moderate and heavy monsoon precipitation in
Historical and GHG, only simulations Krishnan et al. (2016)
have shown that along with increase of atmospheric moisture
the decrease of easterly vertical shear of the SAM circulation
is also pivotal for favouring localized heavy rainfall over the
Indian region (Fig. 3.11b). In a recent study, Singh et al.
(2014) found statistically significant increase in the intensity
and frequency of extreme wet and dry spells during the ISM
during the 1951–2011 period.
3.4.2 Future Projections of Precipitation
Extremes
The IPCC Special Report on Extremes (SREX; Intergovernmental Panel on Climate Change 2012) appraisal reported
that extreme precipitation events globally are certain to rise
in the future. From 1950 onwards, the number of extreme
precipitation events over Indian landmass has also become
more significant than it before (Sillmann et al. 2013; Goswami et al. 2006; Rao et al. 2014). A recent study by
Mukherjee et al. (2017) showed that 1–5-day precipitation
maxima at 5–500 year return period will increase (10–30%)
with anthropogenic warming in RCP8.5 scenario. They
further showed that the frequency of precipitation extremes
is projected to rise more prominently in the RCP8.5 scenario
over southern and central India by the middle and end of the
twenty-first century. The analyses of select precipitationbased indices, defined by the Expert Team on Climate
Moderate
(5-100 mm day -1 )
HIST1
HIST1_GHG
Heavy
( 100 mm day -1 )
Moderate
(5-100 mm day -1 )
Heavy
-90
-60
-30
0
30
60
90
Change in frequency count (%)
Experiment
>
( 100 mm day -1 )
>
b
a
Fig. 3.11 Observed frequency of a heavy (R ! 100 mm/day, bold
line) and moderate (5
R < 100 mm/day, thin line) daily rain events
(Goswami et al. 2006). b Attribution of changes in moderate and heavy
precipitation. Box-whisker plot of percentage distributions of yearly
count of moderate (5–100 mm day
−1
) and heavy ( ! 100 mm day
−1
)
events over Central India (74.5°–86.5° E, 16.5°–26.5° N) during the
period (1951–2000) from Historical and GHG experiments with respect
to the natural only simulation (Krishnan et al. 2016). Permission taken
from American Association for the Advancement of Science for
Fig. 3.11a.
3 Precipitation Changes in India
63
shows an increase in precipitation [CMIP5 (10–20%),
CORDEX (10–25%) and NEX (15–35%)] by the end of the
twenty-first century.
3.4 Changes in Daily Precipitation Extremes
3.4.1 Observed Changes and Their Attribution
Detecting changes in the characteristics of extreme rain
events is an important issue in view of their large impacts on
human society (Ghosh et al. 2016). It is difficult to attribute a
specific extreme event during the monsoon is owing to
anthropogenic climate change—like the Uttarakhand surges
of 2015, or recent flood in Kerala during 2018 monsoon—
yet it is robustly anticipated that a warming atmosphere will
result in more severe weather. It has been observed that from
1950 onwards there has been a significant rising trend in the
frequency and intensity of extreme heavy rain events over
central India, along with a decreasing trend in the moderate
rain events (Goswami et al. 2006; Dash et al. 2009; Kulkarni
et al. 2017; Krishnan et al. 2016; Roxy et al. 2017)
(Fig. 3.11a). Consecutive dry days with minimum spell
length of 5 days show significant increase of about 4 days in
the period 1951–2015, while consecutive wet days show
decrease of about 10 days in this period. Prolonged break
spells appear to be more frequent in 1951–2015. Roxy et al.
(2016) showed that the widespread changes in extreme rain
events are mainly dominated by dynamic response of the
atmosphere rather than thermodynamic factor alone. Krishnan et al. (2016) showed that, the enhancement of such deep
localized convection, leading to heavy rainfall events, are
more likely to happen in an atmosphere with weak vertical
shear (Romatschke and Houze 2011). Increased variability
of low-level monsoon westerlies (Mishra et al. 2018; Roxy
et al. 2017) and warming of north Arabian sea lead to
increased moisture supply and thus enhance such events
(Roxy et al. 2017). By examining the changes in the distribution of moderate and heavy monsoon precipitation in
Historical and GHG, only simulations Krishnan et al. (2016)
have shown that along with increase of atmospheric moisture
the decrease of easterly vertical shear of the SAM circulation
is also pivotal for favouring localized heavy rainfall over the
Indian region (Fig. 3.11b). In a recent study, Singh et al.
(2014) found statistically significant increase in the intensity
and frequency of extreme wet and dry spells during the ISM
during the 1951–2011 period.
3.4.2 Future Projections of Precipitation
Extremes
The IPCC Special Report on Extremes (SREX; Intergovernmental Panel on Climate Change 2012) appraisal reported
that extreme precipitation events globally are certain to rise
in the future. From 1950 onwards, the number of extreme
precipitation events over Indian landmass has also become
more significant than it before (Sillmann et al. 2013; Goswami et al. 2006; Rao et al. 2014). A recent study by
Mukherjee et al. (2017) showed that 1–5-day precipitation
maxima at 5–500 year return period will increase (10–30%)
with anthropogenic warming in RCP8.5 scenario. They
further showed that the frequency of precipitation extremes
is projected to rise more prominently in the RCP8.5 scenario
over southern and central India by the middle and end of the
twenty-first century. The analyses of select precipitationbased indices, defined by the Expert Team on Climate
Moderate
(5-100 mm day -1 )
HIST1
HIST1_GHG
Heavy
( 100 mm day -1 )
Moderate
(5-100 mm day -1 )
Heavy
-90
-60
-30
0
30
60
90
Change in frequency count (%)
Experiment
>
( 100 mm day -1 )
>
b
a
Fig. 3.11 Observed frequency of a heavy (R ! 100 mm/day, bold
line) and moderate (5
R < 100 mm/day, thin line) daily rain events
(Goswami et al. 2006). b Attribution of changes in moderate and heavy
precipitation. Box-whisker plot of percentage distributions of yearly
count of moderate (5–100 mm day
−1
) and heavy ( ! 100 mm day
−1
)
events over Central India (74.5°–86.5° E, 16.5°–26.5° N) during the
period (1951–2000) from Historical and GHG experiments with respect
to the natural only simulation (Krishnan et al. 2016). Permission taken
from American Association for the Advancement of Science for
Fig. 3.11a.
3 Precipitation Changes in India
63