

percentile threshold of daily maximum air temperature from
each CORDEX model outputs after applying a quantile
mapping bias-correction following Lafon et al. (2013),
which was based on an empirical distribution correction
method (Wood et al. 2004). These findings compare
well with the heatwave climatology estimated using the
CMIP5 multi-model ensemble and IMD observations
over north-west India for the present period (Rohini et al.
2019).
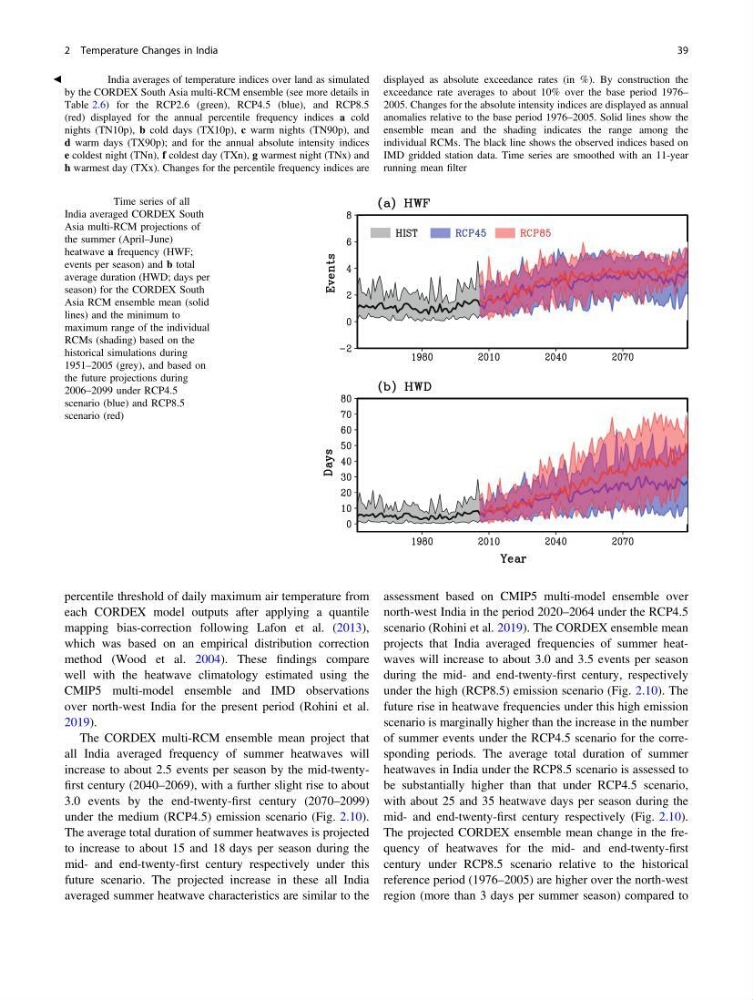
The CORDEX multi-RCM ensemble mean project that
all India averaged frequency of summer heatwaves will
increase to about 2.5 events per season by the mid-twentyfirst century (2040–2069), with a further slight rise to about
3.0 events by the end-twenty-first century (2070–2099)
under the medium (RCP4.5) emission scenario (Fig. 2.10).
The average total duration of summer heatwaves is projected
to increase to about 15 and 18 days per season during the
mid- and end-twenty-first century respectively under this
future scenario. The projected increase in these all India
averaged summer heatwave characteristics are similar to the
assessment based on CMIP5 multi-model ensemble over
north-west India in the period 2020–2064 under the RCP4.5
scenario (Rohini et al. 2019). The CORDEX ensemble mean
projects that India averaged frequencies of summer heatwaves will increase to about 3.0 and 3.5 events per season
during the mid- and end-twenty-first century, respectively
under the high (RCP8.5) emission scenario (Fig. 2.10). The
future rise in heatwave frequencies under this high emission
scenario is marginally higher than the increase in the number
of summer events under the RCP4.5 scenario for the corresponding periods. The average total duration of summer
heatwaves in India under the RCP8.5 scenario is assessed to
be substantially higher than that under RCP4.5 scenario,
with about 25 and 35 heatwave days per season during the
mid- and end-twenty-first century respectively (Fig. 2.10).
The projected CORDEX ensemble mean change in the frequency of heatwaves for the mid- and end-twenty-first
century under RCP8.5 scenario relative to the historical
reference period (1976–2005) are higher over the north-west
region (more than 3 days per summer season) compared to
Fig. 2.10 Time series of all
India averaged CORDEX South
Asia multi-RCM projections of
the summer (April–June)
heatwave a frequency (HWF;
events per season) and b total
average duration (HWD; days per
season) for the CORDEX South
Asia RCM ensemble mean (solid
lines) and the minimum to
maximum range of the individual
RCMs (shading) based on the
historical simulations during
1951–2005 (grey), and based on
the future projections during
2006–2099 under RCP4.5
scenario (blue) and RCP8.5
scenario (red)
b Fig. 2.9 India averages of temperature indices over land as simulated
by the CORDEX South Asia multi-RCM ensemble (see more details in
Table 2.6) for the RCP2.6 (green), RCP4.5 (blue), and RCP8.5
(red) displayed for the annual percentile frequency indices a cold
nights (TN10p), b cold days (TX10p), c warm nights (TN90p), and
d warm days (TX90p); and for the annual absolute intensity indices
e coldest night (TNn), f coldest day (TXn), g warmest night (TNx) and
h warmest day (TXx). Changes for the percentile frequency indices are
displayed as absolute exceedance rates (in %). By construction the
exceedance rate averages to about 10% over the base period 1976–
2005. Changes for the absolute intensity indices are displayed as annual
anomalies relative to the base period 1976–2005. Solid lines show the
ensemble mean and the shading indicates the range among the
individual RCMs. The black line shows the observed indices based on
IMD gridded station data. Time series are smoothed with an 11-year
running mean filter
2 Temperature Changes in India
39
each CORDEX model outputs after applying a quantile
mapping bias-correction following Lafon et al. (2013),
which was based on an empirical distribution correction
method (Wood et al. 2004). These findings compare
well with the heatwave climatology estimated using the
CMIP5 multi-model ensemble and IMD observations
over north-west India for the present period (Rohini et al.
2019).
The CORDEX multi-RCM ensemble mean project that
all India averaged frequency of summer heatwaves will
increase to about 2.5 events per season by the mid-twentyfirst century (2040–2069), with a further slight rise to about
3.0 events by the end-twenty-first century (2070–2099)
under the medium (RCP4.5) emission scenario (Fig. 2.10).
The average total duration of summer heatwaves is projected
to increase to about 15 and 18 days per season during the
mid- and end-twenty-first century respectively under this
future scenario. The projected increase in these all India
averaged summer heatwave characteristics are similar to the
assessment based on CMIP5 multi-model ensemble over
north-west India in the period 2020–2064 under the RCP4.5
scenario (Rohini et al. 2019). The CORDEX ensemble mean
projects that India averaged frequencies of summer heatwaves will increase to about 3.0 and 3.5 events per season
during the mid- and end-twenty-first century, respectively
under the high (RCP8.5) emission scenario (Fig. 2.10). The
future rise in heatwave frequencies under this high emission
scenario is marginally higher than the increase in the number
of summer events under the RCP4.5 scenario for the corresponding periods. The average total duration of summer
heatwaves in India under the RCP8.5 scenario is assessed to
be substantially higher than that under RCP4.5 scenario,
with about 25 and 35 heatwave days per season during the
mid- and end-twenty-first century respectively (Fig. 2.10).
The projected CORDEX ensemble mean change in the frequency of heatwaves for the mid- and end-twenty-first
century under RCP8.5 scenario relative to the historical
reference period (1976–2005) are higher over the north-west
region (more than 3 days per summer season) compared to
Fig. 2.10 Time series of all
India averaged CORDEX South
Asia multi-RCM projections of
the summer (April–June)
heatwave a frequency (HWF;
events per season) and b total
average duration (HWD; days per
season) for the CORDEX South
Asia RCM ensemble mean (solid
lines) and the minimum to
maximum range of the individual
RCMs (shading) based on the
historical simulations during
1951–2005 (grey), and based on
the future projections during
2006–2099 under RCP4.5
scenario (blue) and RCP8.5
scenario (red)
b Fig. 2.9 India averages of temperature indices over land as simulated
by the CORDEX South Asia multi-RCM ensemble (see more details in
Table 2.6) for the RCP2.6 (green), RCP4.5 (blue), and RCP8.5
(red) displayed for the annual percentile frequency indices a cold
nights (TN10p), b cold days (TX10p), c warm nights (TN90p), and
d warm days (TX90p); and for the annual absolute intensity indices
e coldest night (TNn), f coldest day (TXn), g warmest night (TNx) and
h warmest day (TXx). Changes for the percentile frequency indices are
displayed as absolute exceedance rates (in %). By construction the
exceedance rate averages to about 10% over the base period 1976–
2005. Changes for the absolute intensity indices are displayed as annual
anomalies relative to the base period 1976–2005. Solid lines show the
ensemble mean and the shading indicates the range among the
individual RCMs. The black line shows the observed indices based on
IMD gridded station data. Time series are smoothed with an 11-year
running mean filter
2 Temperature Changes in India
39