

Asia REA estimate of warming for the two 30 year future
periods are lower (higher) for the annual means of daily
maximum (minimum) temperature than the respective
warming assessed for the annual mean of daily mean temperature under all three RCP scenarios. The REA changes
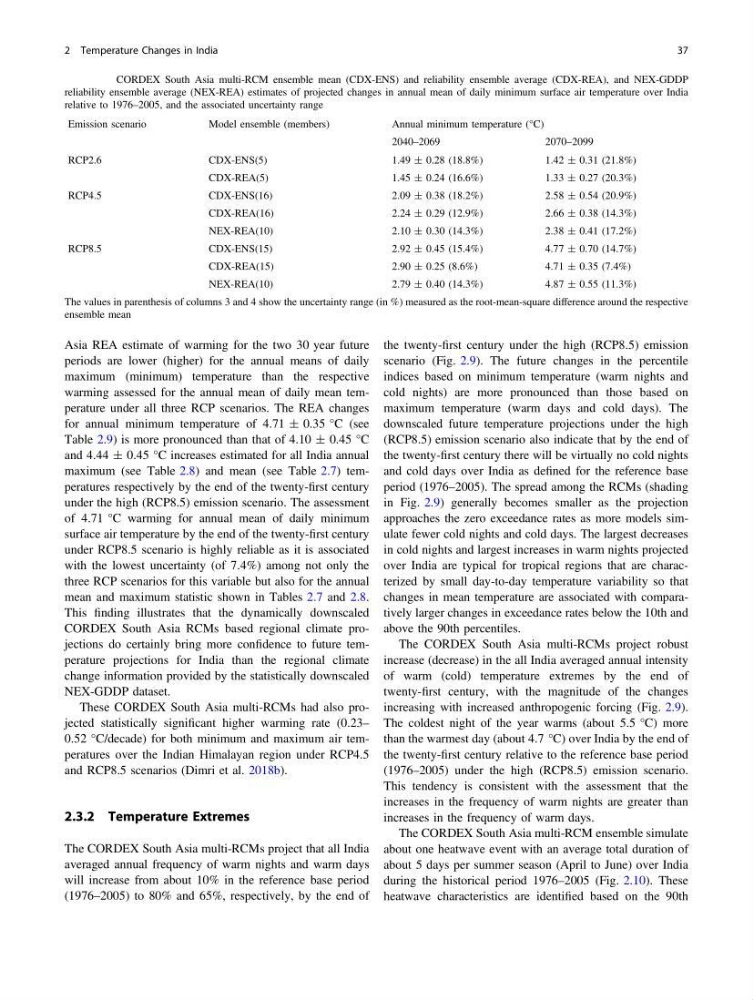
for annual minimum temperature of 4.71 ± 0.35 °C (see
Table 2.9) is more pronounced than that of 4.10 ± 0.45 °C
and 4.44 ± 0.45 °C increases estimated for all India annual
maximum (see Table 2.8) and mean (see Table 2.7) temperatures respectively by the end of the twenty-first century
under the high (RCP8.5) emission scenario. The assessment
of 4.71 °C warming for annual mean of daily minimum
surface air temperature by the end of the twenty-first century
under RCP8.5 scenario is highly reliable as it is associated
with the lowest uncertainty (of 7.4%) among not only the
three RCP scenarios for this variable but also for the annual
mean and maximum statistic shown in Tables 2.7 and 2.8.
This finding illustrates that the dynamically downscaled
CORDEX South Asia RCMs based regional climate projections do certainly bring more confidence to future temperature projections for India than the regional climate
change information provided by the statistically downscaled
NEX-GDDP dataset.
These CORDEX South Asia multi-RCMs had also projected statistically significant higher warming rate (0.23–
0.52 °C/decade) for both minimum and maximum air temperatures over the Indian Himalayan region under RCP4.5
and RCP8.5 scenarios (Dimri et al. 2018b).
2.3.2 Temperature Extremes
The CORDEX South Asia multi-RCMs project that all India
averaged annual frequency of warm nights and warm days
will increase from about 10% in the reference base period
(1976–2005) to 80% and 65%, respectively, by the end of
the twenty-first century under the high (RCP8.5) emission
scenario (Fig. 2.9). The future changes in the percentile
indices based on minimum temperature (warm nights and
cold nights) are more pronounced than those based on
maximum temperature (warm days and cold days). The
downscaled future temperature projections under the high
(RCP8.5) emission scenario also indicate that by the end of
the twenty-first century there will be virtually no cold nights
and cold days over India as defined for the reference base
period (1976–2005). The spread among the RCMs (shading
in Fig. 2.9) generally becomes smaller as the projection
approaches the zero exceedance rates as more models simulate fewer cold nights and cold days. The largest decreases
in cold nights and largest increases in warm nights projected
over India are typical for tropical regions that are characterized by small day-to-day temperature variability so that
changes in mean temperature are associated with comparatively larger changes in exceedance rates below the 10th and
above the 90th percentiles.
The CORDEX South Asia multi-RCMs project robust
increase (decrease) in the all India averaged annual intensity
of warm (cold) temperature extremes by the end of
twenty-first century, with the magnitude of the changes
increasing with increased anthropogenic forcing (Fig. 2.9).
The coldest night of the year warms (about 5.5 °C) more
than the warmest day (about 4.7 °C) over India by the end of
the twenty-first century relative to the reference base period
(1976–2005) under the high (RCP8.5) emission scenario.
This tendency is consistent with the assessment that the
increases in the frequency of warm nights are greater than
increases in the frequency of warm days.
The CORDEX South Asia multi-RCM ensemble simulate
about one heatwave event with an average total duration of
about 5 days per summer season (April to June) over India
during the historical period 1976–2005 (Fig. 2.10). These
heatwave characteristics are identified based on the 90th
Table 2.9 CORDEX South Asia multi-RCM ensemble mean (CDX-ENS) and reliability ensemble average (CDX-REA), and NEX-GDDP
reliability ensemble average (NEX-REA) estimates of projected changes in annual mean of daily minimum surface air temperature over India
relative to 1976–2005, and the associated uncertainty range
Emission scenario
Model ensemble (members)
Annual minimum temperature (°C)
2040–2069
2070–2099
RCP2.6
CDX-ENS(5)
1.49 ± 0.28 (18.8%)
1.42 ± 0.31 (21.8%)
CDX-REA(5)
1.45 ± 0.24 (16.6%)
1.33 ± 0.27 (20.3%)
RCP4.5
CDX-ENS(16)
2.09 ± 0.38 (18.2%)
2.58 ± 0.54 (20.9%)
CDX-REA(16)
2.24 ± 0.29 (12.9%)
2.66 ± 0.38 (14.3%)
NEX-REA(10)
2.10 ± 0.30 (14.3%)
2.38 ± 0.41 (17.2%)
RCP8.5
CDX-ENS(15)
2.92 ± 0.45 (15.4%)
4.77 ± 0.70 (14.7%)
CDX-REA(15)
2.90 ± 0.25 (8.6%)
4.71 ± 0.35 (7.4%)
NEX-REA(10)
2.79 ± 0.40 (14.3%)
4.87 ± 0.55 (11.3%)
The values in parenthesis of columns 3 and 4 show the uncertainty range (in %) measured as the root-mean-square difference around the respective
ensemble mean
2 Temperature Changes in India
37
periods are lower (higher) for the annual means of daily
maximum (minimum) temperature than the respective
warming assessed for the annual mean of daily mean temperature under all three RCP scenarios. The REA changes
for annual minimum temperature of 4.71 ± 0.35 °C (see
Table 2.9) is more pronounced than that of 4.10 ± 0.45 °C
and 4.44 ± 0.45 °C increases estimated for all India annual
maximum (see Table 2.8) and mean (see Table 2.7) temperatures respectively by the end of the twenty-first century
under the high (RCP8.5) emission scenario. The assessment
of 4.71 °C warming for annual mean of daily minimum
surface air temperature by the end of the twenty-first century
under RCP8.5 scenario is highly reliable as it is associated
with the lowest uncertainty (of 7.4%) among not only the
three RCP scenarios for this variable but also for the annual
mean and maximum statistic shown in Tables 2.7 and 2.8.
This finding illustrates that the dynamically downscaled
CORDEX South Asia RCMs based regional climate projections do certainly bring more confidence to future temperature projections for India than the regional climate
change information provided by the statistically downscaled
NEX-GDDP dataset.
These CORDEX South Asia multi-RCMs had also projected statistically significant higher warming rate (0.23–
0.52 °C/decade) for both minimum and maximum air temperatures over the Indian Himalayan region under RCP4.5
and RCP8.5 scenarios (Dimri et al. 2018b).
2.3.2 Temperature Extremes
The CORDEX South Asia multi-RCMs project that all India
averaged annual frequency of warm nights and warm days
will increase from about 10% in the reference base period
(1976–2005) to 80% and 65%, respectively, by the end of
the twenty-first century under the high (RCP8.5) emission
scenario (Fig. 2.9). The future changes in the percentile
indices based on minimum temperature (warm nights and
cold nights) are more pronounced than those based on
maximum temperature (warm days and cold days). The
downscaled future temperature projections under the high
(RCP8.5) emission scenario also indicate that by the end of
the twenty-first century there will be virtually no cold nights
and cold days over India as defined for the reference base
period (1976–2005). The spread among the RCMs (shading
in Fig. 2.9) generally becomes smaller as the projection
approaches the zero exceedance rates as more models simulate fewer cold nights and cold days. The largest decreases
in cold nights and largest increases in warm nights projected
over India are typical for tropical regions that are characterized by small day-to-day temperature variability so that
changes in mean temperature are associated with comparatively larger changes in exceedance rates below the 10th and
above the 90th percentiles.
The CORDEX South Asia multi-RCMs project robust
increase (decrease) in the all India averaged annual intensity
of warm (cold) temperature extremes by the end of
twenty-first century, with the magnitude of the changes
increasing with increased anthropogenic forcing (Fig. 2.9).
The coldest night of the year warms (about 5.5 °C) more
than the warmest day (about 4.7 °C) over India by the end of
the twenty-first century relative to the reference base period
(1976–2005) under the high (RCP8.5) emission scenario.
This tendency is consistent with the assessment that the
increases in the frequency of warm nights are greater than
increases in the frequency of warm days.
The CORDEX South Asia multi-RCM ensemble simulate
about one heatwave event with an average total duration of
about 5 days per summer season (April to June) over India
during the historical period 1976–2005 (Fig. 2.10). These
heatwave characteristics are identified based on the 90th
Table 2.9 CORDEX South Asia multi-RCM ensemble mean (CDX-ENS) and reliability ensemble average (CDX-REA), and NEX-GDDP
reliability ensemble average (NEX-REA) estimates of projected changes in annual mean of daily minimum surface air temperature over India
relative to 1976–2005, and the associated uncertainty range
Emission scenario
Model ensemble (members)
Annual minimum temperature (°C)
2040–2069
2070–2099
RCP2.6
CDX-ENS(5)
1.49 ± 0.28 (18.8%)
1.42 ± 0.31 (21.8%)
CDX-REA(5)
1.45 ± 0.24 (16.6%)
1.33 ± 0.27 (20.3%)
RCP4.5
CDX-ENS(16)
2.09 ± 0.38 (18.2%)
2.58 ± 0.54 (20.9%)
CDX-REA(16)
2.24 ± 0.29 (12.9%)
2.66 ± 0.38 (14.3%)
NEX-REA(10)
2.10 ± 0.30 (14.3%)
2.38 ± 0.41 (17.2%)
RCP8.5
CDX-ENS(15)
2.92 ± 0.45 (15.4%)
4.77 ± 0.70 (14.7%)
CDX-REA(15)
2.90 ± 0.25 (8.6%)
4.71 ± 0.35 (7.4%)
NEX-REA(10)
2.79 ± 0.40 (14.3%)
4.87 ± 0.55 (11.3%)
The values in parenthesis of columns 3 and 4 show the uncertainty range (in %) measured as the root-mean-square difference around the respective
ensemble mean
2 Temperature Changes in India
37