

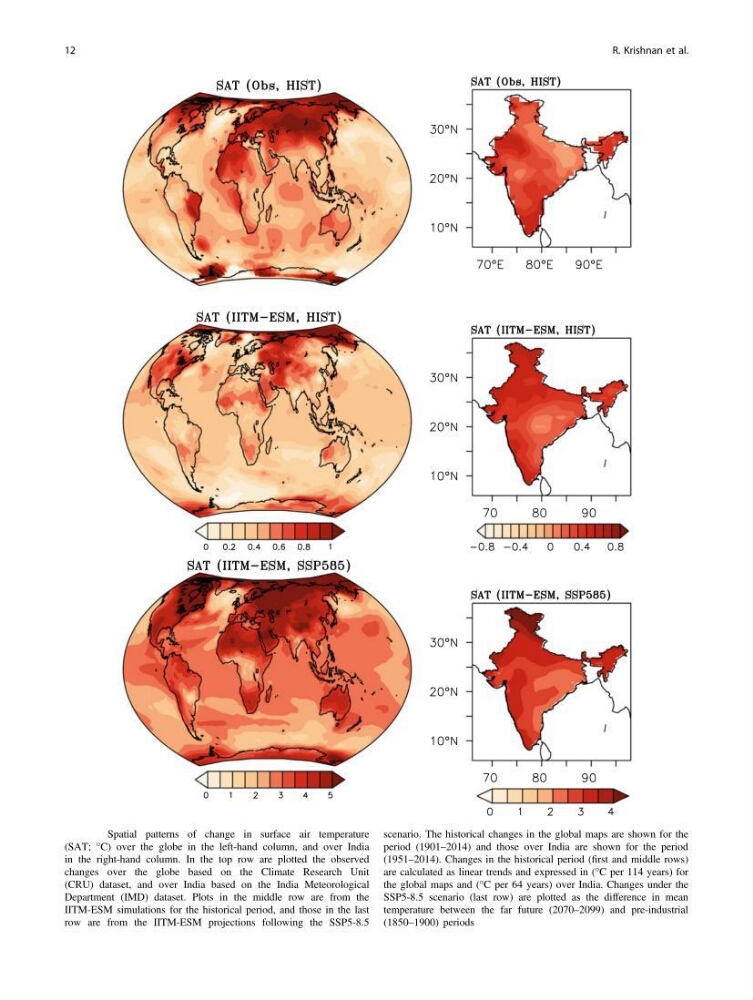
Fig. 1.4 Spatial patterns of change in surface air temperature
(SAT; °C) over the globe in the left-hand column, and over India
in the right-hand column. In the top row are plotted the observed
changes over the globe based on the Climate Research Unit
(CRU) dataset, and over India based on the India Meteorological
Department (IMD) dataset. Plots in the middle row are from the
IITM-ESM simulations for the historical period, and those in the last
row are from the IITM-ESM projections following the SSP5-8.5
scenario. The historical changes in the global maps are shown for the
period (1901–2014) and those over India are shown for the period
(1951–2014). Changes in the historical period (first and middle rows)
are calculated as linear trends and expressed in (°C per 114 years) for
the global maps and (°C per 64 years) over India. Changes under the
SSP5-8.5 scenario (last row) are plotted as the difference in mean
temperature between the far future (2070–2099) and pre-industrial
(1850–1900) periods
12
R. Krishnan et al.
(SAT; °C) over the globe in the left-hand column, and over India
in the right-hand column. In the top row are plotted the observed
changes over the globe based on the Climate Research Unit
(CRU) dataset, and over India based on the India Meteorological
Department (IMD) dataset. Plots in the middle row are from the
IITM-ESM simulations for the historical period, and those in the last
row are from the IITM-ESM projections following the SSP5-8.5
scenario. The historical changes in the global maps are shown for the
period (1901–2014) and those over India are shown for the period
(1951–2014). Changes in the historical period (first and middle rows)
are calculated as linear trends and expressed in (°C per 114 years) for
the global maps and (°C per 64 years) over India. Changes under the
SSP5-8.5 scenario (last row) are plotted as the difference in mean
temperature between the far future (2070–2099) and pre-industrial
(1850–1900) periods
12
R. Krishnan et al.