

certain that GMST has increased since the late nineteenth
century. Each of the past three decades has been successively warmer at the Earth’s surface than all previous decades in the observational record, and the first decade of the
twenty-first century has been the warmest (Hartmann et al.
2013). Global warming attributed to human activities has
now reached approximately 1 °C (likely between 0.8 and
1.2 °C) in the global mean above the mean pre-industrial
temperature (period 1850–1900) and is increasing at 0.2 °C
(likely between 0.1 and 0.3 °C) per decade (Allen et al.
2018). IPCC AR5 also summarized that it is very likely that
the numbers of cold days and nights have decreased and the
numbers of warm days and nights have increased globally
since about 1950. Regional trends are sufficiently complete
over 1901–2012 and show that almost the entire globe,
including both land and ocean, has experienced surface
warming.
IPCC AR5 assessed that it is virtually certain that globally the troposphere has warmed and the lower stratosphere
has cooled since the mid-twentieth century based on multiple
independent analyses of measurements from radiosondes
and satellite sensors. However, there is low confidence in the
rate of temperature change, and its vertical structure, in most
areas of the planet.
According to IPCC AR5, anthropogenic forcing has
contributed substantially to upper-ocean warming (above
700 m). On a global scale, ocean warming is largest near the
surface, with the upper 75 m having warmed by 0.11 [0.09
to 0.13] °C per decade over the period 1971–2010 (Stocker
et al. 2013).
Warming is expected to elevate the rate of evaporation
and increase the moisture content of the atmospheric.
Indeed, the amount of water vapour in the atmosphere,
measured as specific humidity, has increased globally over
both the land and ocean. IPCC AR5 summarized that it is
very likely that global near-surface air specific humidity has
increased since the 1970s (Hartmann et al. 2013). However,
during recent years the near-surface moistening over land
has abated (medium confidence). As a result, fairly widespread decreases in relative humidity near the surface are
observed over land in recent years.
IPCC AR5 concluded that confidence in precipitation
change averaged over global land areas since 1901 is low for
years prior to 1951 and medium afterwards. Averaged over
the mid-latitude land areas of the northern hemisphere, precipitation has likely increased since 1901 (medium confidence before and high confidence after 1951) (Hartmann
et al. 2013). Precipitation in tropical land areas has increased
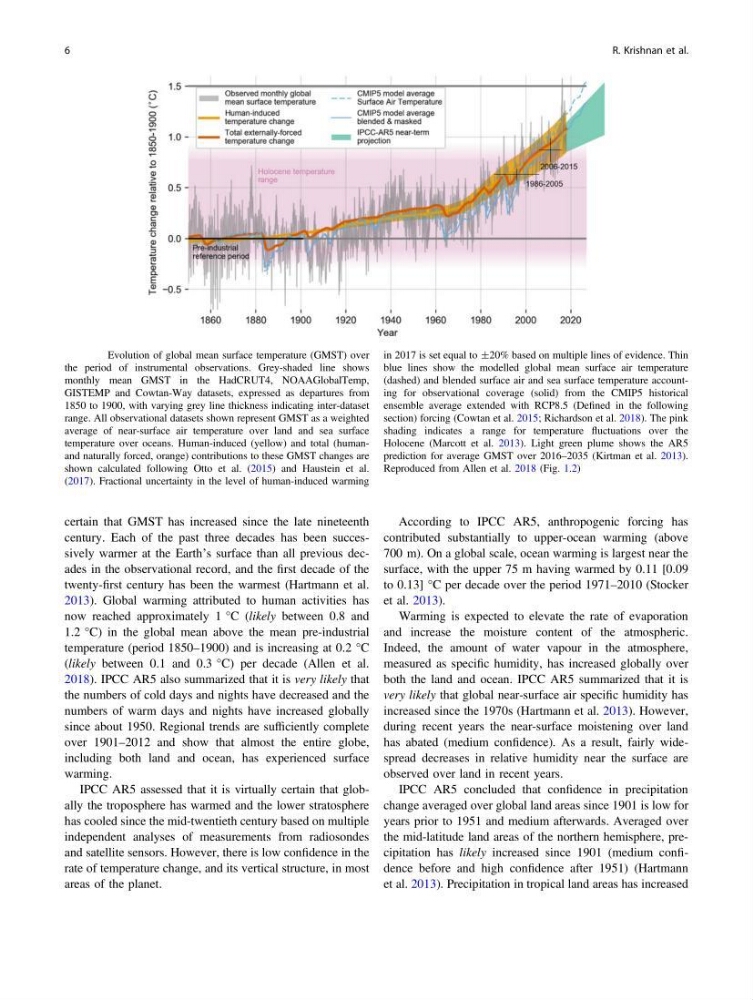
Fig. 1.2 Evolution of global mean surface temperature (GMST) over
the period of instrumental observations. Grey-shaded line shows
monthly mean GMST in the HadCRUT4, NOAAGlobalTemp,
GISTEMP and Cowtan-Way datasets, expressed as departures from
1850 to 1900, with varying grey line thickness indicating inter-dataset
range. All observational datasets shown represent GMST as a weighted
average of near-surface air temperature over land and sea surface
temperature over oceans. Human-induced (yellow) and total (humanand naturally forced, orange) contributions to these GMST changes are
shown calculated following Otto et al. (2015) and Haustein et al.
(2017). Fractional uncertainty in the level of human-induced warming
in 2017 is set equal to ±20% based on multiple lines of evidence. Thin
blue lines show the modelled global mean surface air temperature
(dashed) and blended surface air and sea surface temperature accounting for observational coverage (solid) from the CMIP5 historical
ensemble average extended with RCP8.5 (Defined in the following
section) forcing (Cowtan et al. 2015; Richardson et al. 2018). The pink
shading indicates a range for temperature fluctuations over the
Holocene (Marcott et al. 2013). Light green plume shows the AR5
prediction for average GMST over 2016–2035 (Kirtman et al. 2013).
Reproduced from Allen et al. 2018 (Fig. 1.2)
6
R. Krishnan et al.
century. Each of the past three decades has been successively warmer at the Earth’s surface than all previous decades in the observational record, and the first decade of the
twenty-first century has been the warmest (Hartmann et al.
2013). Global warming attributed to human activities has
now reached approximately 1 °C (likely between 0.8 and
1.2 °C) in the global mean above the mean pre-industrial
temperature (period 1850–1900) and is increasing at 0.2 °C
(likely between 0.1 and 0.3 °C) per decade (Allen et al.
2018). IPCC AR5 also summarized that it is very likely that
the numbers of cold days and nights have decreased and the
numbers of warm days and nights have increased globally
since about 1950. Regional trends are sufficiently complete
over 1901–2012 and show that almost the entire globe,
including both land and ocean, has experienced surface
warming.
IPCC AR5 assessed that it is virtually certain that globally the troposphere has warmed and the lower stratosphere
has cooled since the mid-twentieth century based on multiple
independent analyses of measurements from radiosondes
and satellite sensors. However, there is low confidence in the
rate of temperature change, and its vertical structure, in most
areas of the planet.
According to IPCC AR5, anthropogenic forcing has
contributed substantially to upper-ocean warming (above
700 m). On a global scale, ocean warming is largest near the
surface, with the upper 75 m having warmed by 0.11 [0.09
to 0.13] °C per decade over the period 1971–2010 (Stocker
et al. 2013).
Warming is expected to elevate the rate of evaporation
and increase the moisture content of the atmospheric.
Indeed, the amount of water vapour in the atmosphere,
measured as specific humidity, has increased globally over
both the land and ocean. IPCC AR5 summarized that it is
very likely that global near-surface air specific humidity has
increased since the 1970s (Hartmann et al. 2013). However,
during recent years the near-surface moistening over land
has abated (medium confidence). As a result, fairly widespread decreases in relative humidity near the surface are
observed over land in recent years.
IPCC AR5 concluded that confidence in precipitation
change averaged over global land areas since 1901 is low for
years prior to 1951 and medium afterwards. Averaged over
the mid-latitude land areas of the northern hemisphere, precipitation has likely increased since 1901 (medium confidence before and high confidence after 1951) (Hartmann
et al. 2013). Precipitation in tropical land areas has increased
Fig. 1.2 Evolution of global mean surface temperature (GMST) over
the period of instrumental observations. Grey-shaded line shows
monthly mean GMST in the HadCRUT4, NOAAGlobalTemp,
GISTEMP and Cowtan-Way datasets, expressed as departures from
1850 to 1900, with varying grey line thickness indicating inter-dataset
range. All observational datasets shown represent GMST as a weighted
average of near-surface air temperature over land and sea surface
temperature over oceans. Human-induced (yellow) and total (humanand naturally forced, orange) contributions to these GMST changes are
shown calculated following Otto et al. (2015) and Haustein et al.
(2017). Fractional uncertainty in the level of human-induced warming
in 2017 is set equal to ±20% based on multiple lines of evidence. Thin
blue lines show the modelled global mean surface air temperature
(dashed) and blended surface air and sea surface temperature accounting for observational coverage (solid) from the CMIP5 historical
ensemble average extended with RCP8.5 (Defined in the following
section) forcing (Cowtan et al. 2015; Richardson et al. 2018). The pink
shading indicates a range for temperature fluctuations over the
Holocene (Marcott et al. 2013). Light green plume shows the AR5
prediction for average GMST over 2016–2035 (Kirtman et al. 2013).
Reproduced from Allen et al. 2018 (Fig. 1.2)
6
R. Krishnan et al.