

10.3 Changes in Ocean Heat Content
Contemporary global warming is driven by the additional
heat trapped by greenhouse gases (GHGs) due to the Earth’s
energy imbalance between the energy absorbed and emitted.
More than 90% of this additional heat is stored in the ocean,
increasing ocean heat content (OHC), while the residual heat
is manifested in the form of melting of both land and sea ice,
and in warming of the atmosphere and land surface. This
makes it critical to monitor changes in OHC in order to
understand the rate and extent of global warming (Von
Schuckmann et al. 2014). The ocean’s interior is more
sensitive to small external forcing than the global surface
ocean because it is highly sensitive to heat exchange in the
high-latitudes (e.g. Rosenthal et al. 2017). Monitoring
regional variations in OHC are also important for understanding climate variability and change (Allison et al. 2019).
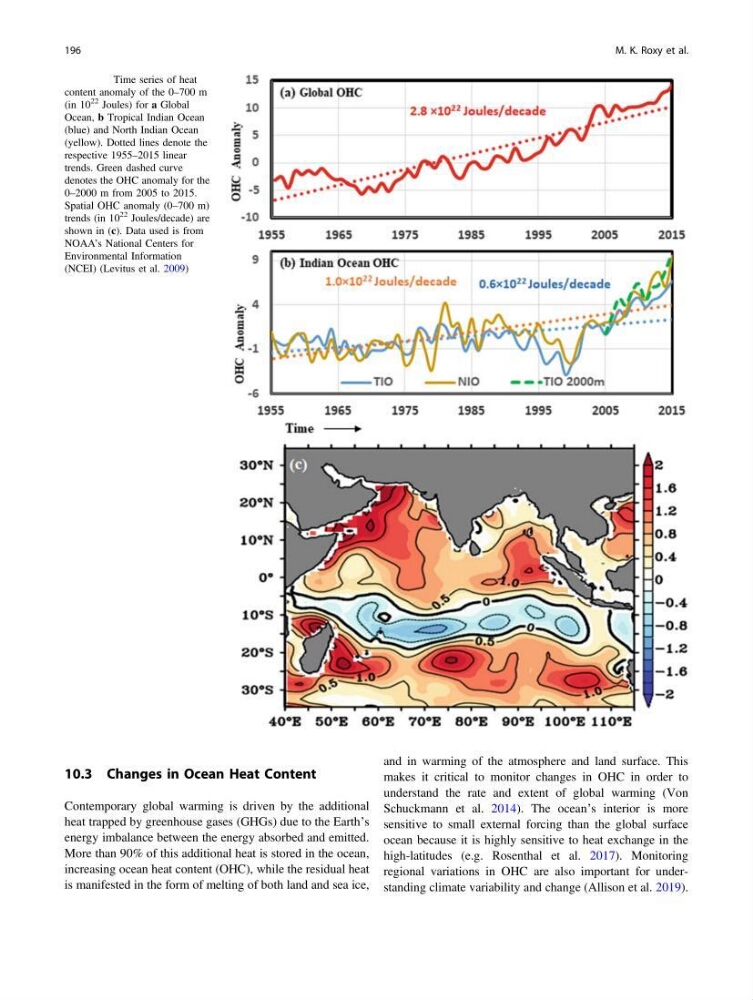
Fig. 10.3 Time series of heat
content anomaly of the 0–700 m
(in 10
22 Joules) for a Global
Ocean, b Tropical Indian Ocean
(blue) and North Indian Ocean
(yellow). Dotted lines denote the
respective 1955–2015 linear
trends. Green dashed curve
denotes the OHC anomaly for the
0–2000 m from 2005 to 2015.
Spatial OHC anomaly (0–700 m)
trends (in 10
22 Joules/decade) are
shown in (c). Data used is from
NOAA’s National Centers for
Environmental Information
(NCEI) (Levitus et al. 2009)
196
M. K. Roxy et al.
Contemporary global warming is driven by the additional
heat trapped by greenhouse gases (GHGs) due to the Earth’s
energy imbalance between the energy absorbed and emitted.
More than 90% of this additional heat is stored in the ocean,
increasing ocean heat content (OHC), while the residual heat
is manifested in the form of melting of both land and sea ice,
and in warming of the atmosphere and land surface. This
makes it critical to monitor changes in OHC in order to
understand the rate and extent of global warming (Von
Schuckmann et al. 2014). The ocean’s interior is more
sensitive to small external forcing than the global surface
ocean because it is highly sensitive to heat exchange in the
high-latitudes (e.g. Rosenthal et al. 2017). Monitoring
regional variations in OHC are also important for understanding climate variability and change (Allison et al. 2019).
Fig. 10.3 Time series of heat
content anomaly of the 0–700 m
(in 10
22 Joules) for a Global
Ocean, b Tropical Indian Ocean
(blue) and North Indian Ocean
(yellow). Dotted lines denote the
respective 1955–2015 linear
trends. Green dashed curve
denotes the OHC anomaly for the
0–2000 m from 2005 to 2015.
Spatial OHC anomaly (0–700 m)
trends (in 10
22 Joules/decade) are
shown in (c). Data used is from
NOAA’s National Centers for
Environmental Information
(NCEI) (Levitus et al. 2009)
196
M. K. Roxy et al.