

temperatures were 3–5 °C higher than present values (Dutton and Lambeck 2012). It was shown that loss of ice from
the Greenland ice sheet must have contributed to about 4 m
of this higher sea level and there may also have been a
contribution from the Antarctic ice sheet (Shepherd et al.
2018). Sea level was 120 m or more below present-day
values at the last glacial maximum about 21,000 years ago
(Peltier and Fairbanks 2006). Further, the Third Assessment
Report (TAR) of the IPCC reported that during the disintegration of the northern hemisphere ice sheets at the end of
the last glacial maximum, sea level rose at an average rate of
1 m century
−1 , with peak rates of about 4 m century
−1 .
Since the end of the last deglaciation about 3000 years ago,
sea level remained nearly constant (e.g. Lambeck et al. 2010;
Kemp et al. 2011a, b).
Proxy and instrumental sea-level data indicate a transition
in the late nineteenth century to the early twentieth century
from relatively low mean rates of rising over the previous
two millennia to higher rates of rise as shown in Fig. 9.2a.
There have been many studies of twentieth-century sea-level
rise based on analysis of past tide gauge data. For example,
an estimate of global mean sea-level change over the last
century based mainly on tide gauge observations is
1.5 ± 0.5 mm year
−1 (Church et al. 2001). Since the
beginning of the twentieth century, the sea-level rise was at
an average rate of 1.7 (1.5–1.9) mm year
−1 between 1901
and 2010 (Church and White 2011). This rise has accelerated
recently, and the rate of global sea-level rise estimated from
satellite altimetry during 1993–2010 is 3.3 (2.8–3.6) mm
year
−1 , significantly higher than the rate estimated for the
entire twentieth century. The spatial trend in sea-level
anomalies from satellite data for the period 1993–2017 is
shown in Fig. 9.2b. The most recent global mean sea-level
trend during the period 1993–2017 amounts to
3.3 ± 0.5 mm year
−1 at a 90% confidence level (WCRP
2018). This increase, however, has not happened at a constant rate and also sea-level rise is not globally uniform (e.g.
Woodworth and Player 2003; Bindoff et al. 2007), i.e.
sea-level variability, as well as trends, differs from region to
region.
Accurate assessment of present-day global mean sea-level
variations and its components (ocean thermal expansion, ice
sheet mass loss, glaciers mass change, changes in land water
storage, etc.) are highly essential. GMSL change as a function of time t is usually expressed by the sea-level budget
equation:
GMSL t
ð Þ ¼ GMSL t
ð Þ steric þ GMSL t
ð Þ ocean mass
ð1Þ
where GMSL(t) steric refers to the contributions of ocean
thermal/haline expansion/contraction to sea-level change,
and GMSL(t) ocean mass refers to the change in mass of the
ocean caused mainly by the melting of ice sheets. The closure of the global sea-level budget was examined by WCRP
(2018), comparing the observed global mean sea level with
the sum of its components. Ocean thermal expansion, glaciers, Greenland and Antarctica contribute 42, 21, 15 and 8%
to the global mean sea level over the 1993–present period
(WCRP 2018). The time evolution of the global sea-level
budget based on WCRP (2018) is shown in Fig. 9.2c. It can
be seen from Fig. 9.2c that the sum of thermal expansion
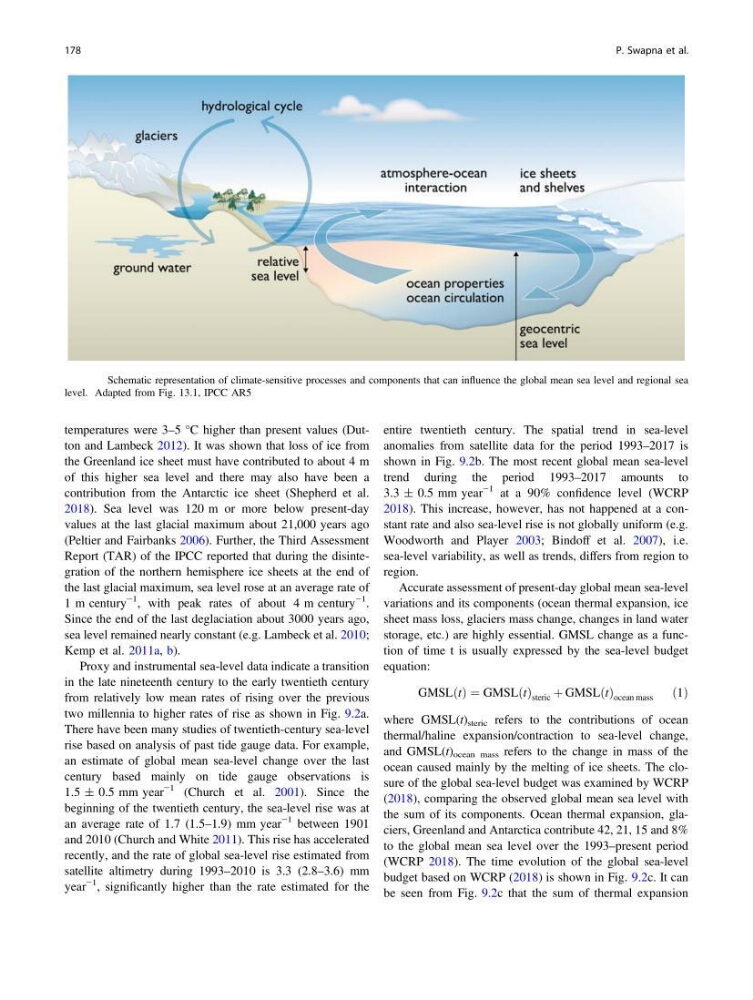
Fig. 9.1 Schematic representation of climate-sensitive processes and components that can influence the global mean sea level and regional sea
level. Adapted from Fig. 13.1, IPCC AR5
178
P. Swapna et al.
the Greenland ice sheet must have contributed to about 4 m
of this higher sea level and there may also have been a
contribution from the Antarctic ice sheet (Shepherd et al.
2018). Sea level was 120 m or more below present-day
values at the last glacial maximum about 21,000 years ago
(Peltier and Fairbanks 2006). Further, the Third Assessment
Report (TAR) of the IPCC reported that during the disintegration of the northern hemisphere ice sheets at the end of
the last glacial maximum, sea level rose at an average rate of
1 m century
−1 , with peak rates of about 4 m century
−1 .
Since the end of the last deglaciation about 3000 years ago,
sea level remained nearly constant (e.g. Lambeck et al. 2010;
Kemp et al. 2011a, b).
Proxy and instrumental sea-level data indicate a transition
in the late nineteenth century to the early twentieth century
from relatively low mean rates of rising over the previous
two millennia to higher rates of rise as shown in Fig. 9.2a.
There have been many studies of twentieth-century sea-level
rise based on analysis of past tide gauge data. For example,
an estimate of global mean sea-level change over the last
century based mainly on tide gauge observations is
1.5 ± 0.5 mm year
−1 (Church et al. 2001). Since the
beginning of the twentieth century, the sea-level rise was at
an average rate of 1.7 (1.5–1.9) mm year
−1 between 1901
and 2010 (Church and White 2011). This rise has accelerated
recently, and the rate of global sea-level rise estimated from
satellite altimetry during 1993–2010 is 3.3 (2.8–3.6) mm
year
−1 , significantly higher than the rate estimated for the
entire twentieth century. The spatial trend in sea-level
anomalies from satellite data for the period 1993–2017 is
shown in Fig. 9.2b. The most recent global mean sea-level
trend during the period 1993–2017 amounts to
3.3 ± 0.5 mm year
−1 at a 90% confidence level (WCRP
2018). This increase, however, has not happened at a constant rate and also sea-level rise is not globally uniform (e.g.
Woodworth and Player 2003; Bindoff et al. 2007), i.e.
sea-level variability, as well as trends, differs from region to
region.
Accurate assessment of present-day global mean sea-level
variations and its components (ocean thermal expansion, ice
sheet mass loss, glaciers mass change, changes in land water
storage, etc.) are highly essential. GMSL change as a function of time t is usually expressed by the sea-level budget
equation:
GMSL t
ð Þ ¼ GMSL t
ð Þ steric þ GMSL t
ð Þ ocean mass
ð1Þ
where GMSL(t) steric refers to the contributions of ocean
thermal/haline expansion/contraction to sea-level change,
and GMSL(t) ocean mass refers to the change in mass of the
ocean caused mainly by the melting of ice sheets. The closure of the global sea-level budget was examined by WCRP
(2018), comparing the observed global mean sea level with
the sum of its components. Ocean thermal expansion, glaciers, Greenland and Antarctica contribute 42, 21, 15 and 8%
to the global mean sea level over the 1993–present period
(WCRP 2018). The time evolution of the global sea-level
budget based on WCRP (2018) is shown in Fig. 9.2c. It can
be seen from Fig. 9.2c that the sum of thermal expansion
Fig. 9.1 Schematic representation of climate-sensitive processes and components that can influence the global mean sea level and regional sea
level. Adapted from Fig. 13.1, IPCC AR5
178
P. Swapna et al.