

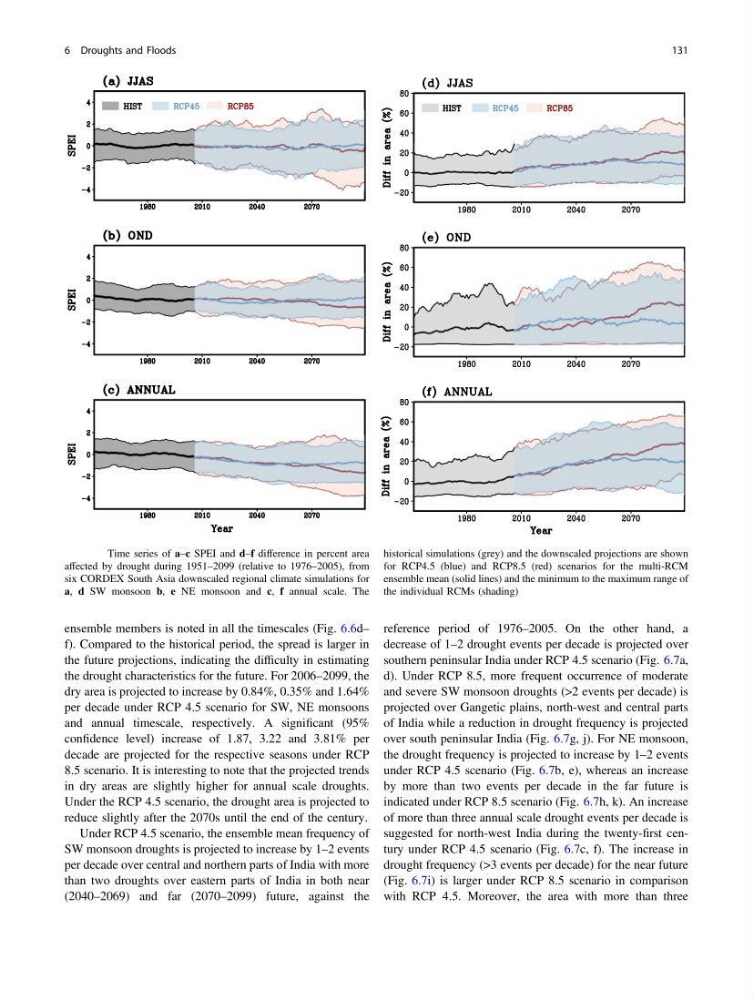
ensemble members is noted in all the timescales (Fig. 6.6d–
f). Compared to the historical period, the spread is larger in
the future projections, indicating the difficulty in estimating
the drought characteristics for the future. For 2006–2099, the
dry area is projected to increase by 0.84%, 0.35% and 1.64%
per decade under RCP 4.5 scenario for SW, NE monsoons
and annual timescale, respectively. A significant (95%
confidence level) increase of 1.87, 3.22 and 3.81% per
decade are projected for the respective seasons under RCP
8.5 scenario. It is interesting to note that the projected trends
in dry areas are slightly higher for annual scale droughts.
Under the RCP 4.5 scenario, the drought area is projected to
reduce slightly after the 2070s until the end of the century.
Under RCP 4.5 scenario, the ensemble mean frequency of
SW monsoon droughts is projected to increase by 1–2 events
per decade over central and northern parts of India with more
than two droughts over eastern parts of India in both near
(2040–2069) and far (2070–2099) future, against the
reference period of 1976–2005. On the other hand, a
decrease of 1–2 drought events per decade is projected over
southern peninsular India under RCP 4.5 scenario (Fig. 6.7a,
d). Under RCP 8.5, more frequent occurrence of moderate
and severe SW monsoon droughts (>2 events per decade) is
projected over Gangetic plains, north-west and central parts
of India while a reduction in drought frequency is projected
over south peninsular India (Fig. 6.7g, j). For NE monsoon,
the drought frequency is projected to increase by 1–2 events
under RCP 4.5 scenario (Fig. 6.7b, e), whereas an increase
by more than two events per decade in the far future is
indicated under RCP 8.5 scenario (Fig. 6.7h, k). An increase
of more than three annual scale drought events per decade is
suggested for north-west India during the twenty-first century under RCP 4.5 scenario (Fig. 6.7c, f). The increase in
drought frequency (>3 events per decade) for the near future
(Fig. 6.7i) is larger under RCP 8.5 scenario in comparison
with RCP 4.5. Moreover, the area with more than three
Fig. 6.6 Time series of a–c SPEI and d–f difference in percent area
affected by drought during 1951–2099 (relative to 1976–2005), from
six CORDEX South Asia downscaled regional climate simulations for
a, d SW monsoon b, e NE monsoon and c, f annual scale. The
historical simulations (grey) and the downscaled projections are shown
for RCP4.5 (blue) and RCP8.5 (red) scenarios for the multi-RCM
ensemble mean (solid lines) and the minimum to the maximum range of
the individual RCMs (shading)
6 Droughts and Floods
131
f). Compared to the historical period, the spread is larger in
the future projections, indicating the difficulty in estimating
the drought characteristics for the future. For 2006–2099, the
dry area is projected to increase by 0.84%, 0.35% and 1.64%
per decade under RCP 4.5 scenario for SW, NE monsoons
and annual timescale, respectively. A significant (95%
confidence level) increase of 1.87, 3.22 and 3.81% per
decade are projected for the respective seasons under RCP
8.5 scenario. It is interesting to note that the projected trends
in dry areas are slightly higher for annual scale droughts.
Under the RCP 4.5 scenario, the drought area is projected to
reduce slightly after the 2070s until the end of the century.
Under RCP 4.5 scenario, the ensemble mean frequency of
SW monsoon droughts is projected to increase by 1–2 events
per decade over central and northern parts of India with more
than two droughts over eastern parts of India in both near
(2040–2069) and far (2070–2099) future, against the
reference period of 1976–2005. On the other hand, a
decrease of 1–2 drought events per decade is projected over
southern peninsular India under RCP 4.5 scenario (Fig. 6.7a,
d). Under RCP 8.5, more frequent occurrence of moderate
and severe SW monsoon droughts (>2 events per decade) is
projected over Gangetic plains, north-west and central parts
of India while a reduction in drought frequency is projected
over south peninsular India (Fig. 6.7g, j). For NE monsoon,
the drought frequency is projected to increase by 1–2 events
under RCP 4.5 scenario (Fig. 6.7b, e), whereas an increase
by more than two events per decade in the far future is
indicated under RCP 8.5 scenario (Fig. 6.7h, k). An increase
of more than three annual scale drought events per decade is
suggested for north-west India during the twenty-first century under RCP 4.5 scenario (Fig. 6.7c, f). The increase in
drought frequency (>3 events per decade) for the near future
(Fig. 6.7i) is larger under RCP 8.5 scenario in comparison
with RCP 4.5. Moreover, the area with more than three
Fig. 6.6 Time series of a–c SPEI and d–f difference in percent area
affected by drought during 1951–2099 (relative to 1976–2005), from
six CORDEX South Asia downscaled regional climate simulations for
a, d SW monsoon b, e NE monsoon and c, f annual scale. The
historical simulations (grey) and the downscaled projections are shown
for RCP4.5 (blue) and RCP8.5 (red) scenarios for the multi-RCM
ensemble mean (solid lines) and the minimum to the maximum range of
the individual RCMs (shading)
6 Droughts and Floods
131