

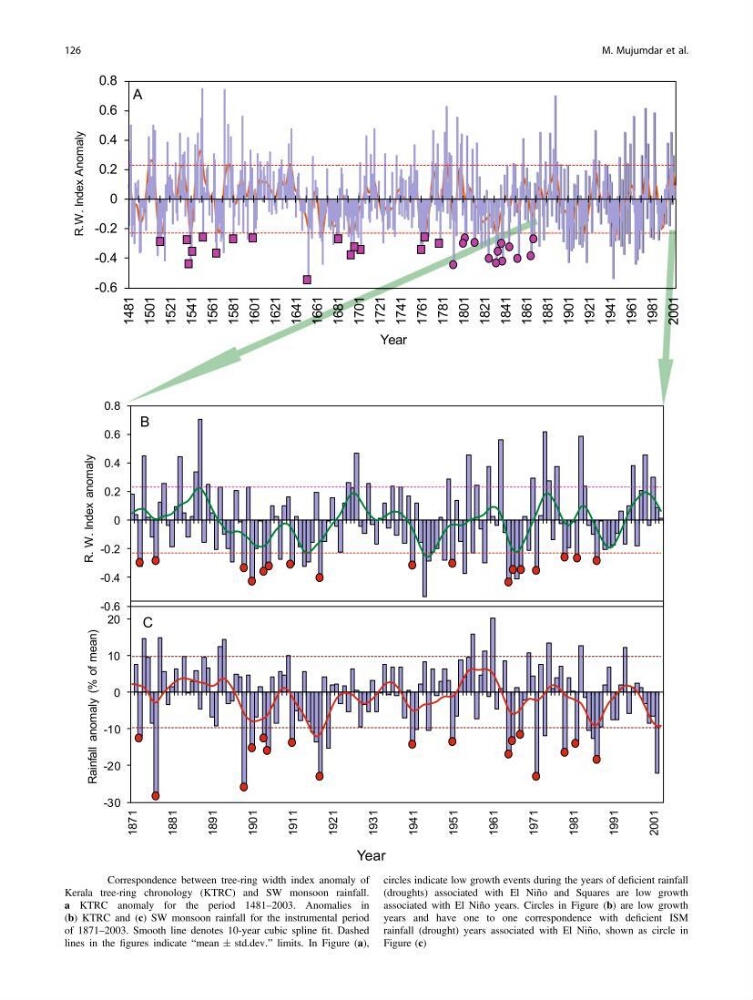
Fig. 6.4 Correspondence between tree-ring width index anomaly of
Kerala tree-ring chronology (KTRC) and SW monsoon rainfall.
a KTRC anomaly for the period 1481–2003. Anomalies in
(b) KTRC and (c) SW monsoon rainfall for the instrumental period
of 1871–2003. Smooth line denotes 10-year cubic spline fit. Dashed
lines in the figures indicate “mean ± std.dev.” limits. In Figure (a),
circles indicate low growth events during the years of deficient rainfall
(droughts) associated with El Niño and Squares are low growth
associated with El Niño years. Circles in Figure (b) are low growth
years and have one to one correspondence with deficient ISM
rainfall (drought) years associated with El Niño, shown as circle in
Figure (c)
126
M. Mujumdar et al.
Kerala tree-ring chronology (KTRC) and SW monsoon rainfall.
a KTRC anomaly for the period 1481–2003. Anomalies in
(b) KTRC and (c) SW monsoon rainfall for the instrumental period
of 1871–2003. Smooth line denotes 10-year cubic spline fit. Dashed
lines in the figures indicate “mean ± std.dev.” limits. In Figure (a),
circles indicate low growth events during the years of deficient rainfall
(droughts) associated with El Niño and Squares are low growth
associated with El Niño years. Circles in Figure (b) are low growth
years and have one to one correspondence with deficient ISM
rainfall (drought) years associated with El Niño, shown as circle in
Figure (c)
126
M. Mujumdar et al.