

monsoon seasons and annual timescale, respectively, with
about 1–2 wet monsoon years per decade. The second half of
data period (1951–2016) has witnessed frequent droughts
with 14, 11 and 12 cases, compared to the previous period
1901–1950 (7, 8 and 6), for the SW, NE monsoon seasons
and annual timescale, respectively.
The number of severe to extreme drought cases (SPEI
−1.5) for 1951–2016 period is 6, 4 and 5 for the SW, NE
monsoon seasons, and annual timescales respectively,
compared to 2, 5 and 1 during 1901–1950 (Fig. 6.1a–c).
Additionally, an increasing trend in drought area is observed
for the entire period of analysis (1901–2016), with a
Fig. 6.2 Spatial pattern of trends (decade
−1
) in a SPEI-SW for JJAS,
b SPEI-NE for OND and c SPEI-ANN for annual, during 1951–2016.
Regions with statistically significant (at 95% confidence level) trends
are hatched. d Frequency of annual droughts (SPEI-ANN −1.0) per
decade, from 1951 to 2016
6 Droughts and Floods
121
about 1–2 wet monsoon years per decade. The second half of
data period (1951–2016) has witnessed frequent droughts
with 14, 11 and 12 cases, compared to the previous period
1901–1950 (7, 8 and 6), for the SW, NE monsoon seasons
and annual timescale, respectively.
The number of severe to extreme drought cases (SPEI
−1.5) for 1951–2016 period is 6, 4 and 5 for the SW, NE
monsoon seasons, and annual timescales respectively,
compared to 2, 5 and 1 during 1901–1950 (Fig. 6.1a–c).
Additionally, an increasing trend in drought area is observed
for the entire period of analysis (1901–2016), with a
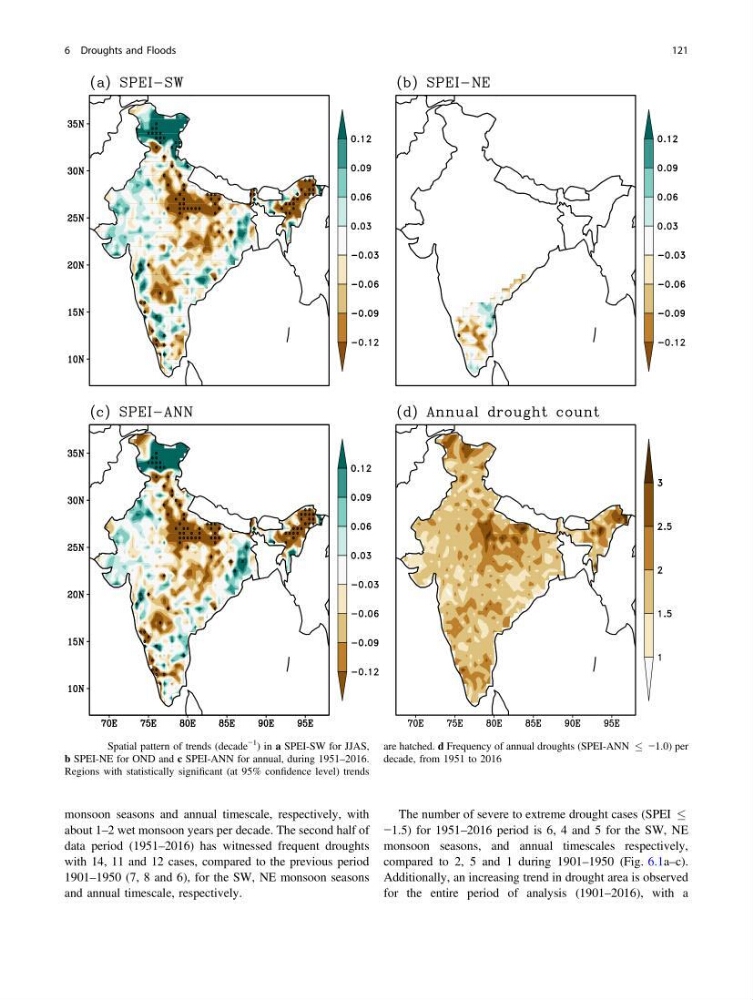
Fig. 6.2 Spatial pattern of trends (decade
−1
) in a SPEI-SW for JJAS,
b SPEI-NE for OND and c SPEI-ANN for annual, during 1951–2016.
Regions with statistically significant (at 95% confidence level) trends
are hatched. d Frequency of annual droughts (SPEI-ANN −1.0) per
decade, from 1951 to 2016
6 Droughts and Floods
121