

influence of NE monsoon. The NE monsoon region
comprises of 5 meteorological sub-divisions over the
southern peninsular India, namely, coastal Andhra
Pradesh, Rayalaseema, South interior Karnataka,
Kerala and Tamil Nadu.
For both SW and NE monsoons, the time series of SPEI
shows considerable interannual and multidecadal variations
with a slight negative trend (Fig. 6.1a, b), corresponding to
the respective monsoon rainfall variations. The declining
trend in SPEI time series is indicative of an increase in the
intensity of droughts. The annual scale SPEI time series is
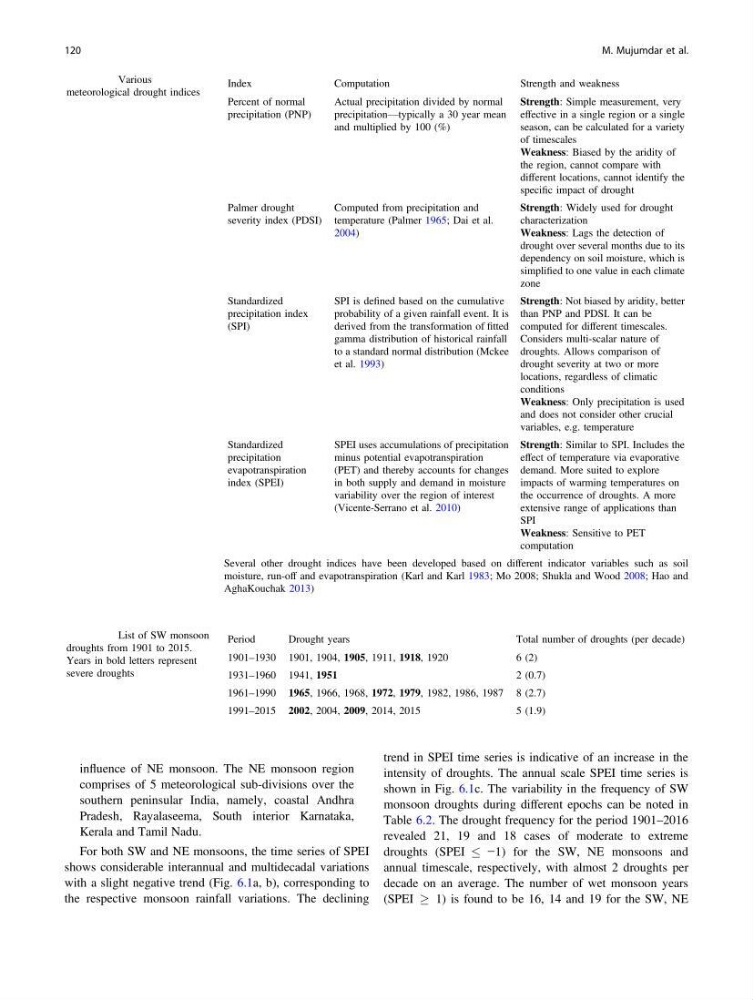
shown in Fig. 6.1c. The variability in the frequency of SW
monsoon droughts during different epochs can be noted in
Table 6.2. The drought frequency for the period 1901–2016
revealed 21, 19 and 18 cases of moderate to extreme
droughts (SPEI −1) for the SW, NE monsoons and
annual timescale, respectively, with almost 2 droughts per
decade on an average. The number of wet monsoon years
(SPEI 1) is found to be 16, 14 and 19 for the SW, NE
Table 6.1 Various
meteorological drought indices
Index
Computation
Strength and weakness
Percent of normal
precipitation (PNP)
Actual precipitation divided by normal
precipitation—typically a 30 year mean
and multiplied by 100 (%)
Strength: Simple measurement, very
effective in a single region or a single
season, can be calculated for a variety
of timescales
Weakness: Biased by the aridity of
the region, cannot compare with
different locations, cannot identify the
specific impact of drought
Palmer drought
severity index (PDSI)
Computed from precipitation and
temperature (Palmer 1965; Dai et al.
2004)
Strength: Widely used for drought
characterization
Weakness: Lags the detection of
drought over several months due to its
dependency on soil moisture, which is
simplified to one value in each climate
zone
Standardized
precipitation index
(SPI)
SPI is defined based on the cumulative
probability of a given rainfall event. It is
derived from the transformation of fitted
gamma distribution of historical rainfall
to a standard normal distribution (Mckee
et al. 1993)
Strength: Not biased by aridity, better
than PNP and PDSI. It can be
computed for different timescales.
Considers multi-scalar nature of
droughts. Allows comparison of
drought severity at two or more
locations, regardless of climatic
conditions
Weakness: Only precipitation is used
and does not consider other crucial
variables, e.g. temperature
Standardized
precipitation
evapotranspiration
index (SPEI)
SPEI uses accumulations of precipitation
minus potential evapotranspiration
(PET) and thereby accounts for changes
in both supply and demand in moisture
variability over the region of interest
(Vicente-Serrano et al. 2010)
Strength: Similar to SPI. Includes the
effect of temperature via evaporative
demand. More suited to explore
impacts of warming temperatures on
the occurrence of droughts. A more
extensive range of applications than
SPI
Weakness: Sensitive to PET
computation
Several other drought indices have been developed based on different indicator variables such as soil
moisture, run-off and evapotranspiration (Karl and Karl 1983; Mo 2008; Shukla and Wood 2008; Hao and
AghaKouchak 2013)
Table 6.2 List of SW monsoon
droughts from 1901 to 2015.
Years in bold letters represent
severe droughts
Period
Drought years
Total number of droughts (per decade)
1901–1930 1901, 1904, 1905, 1911, 1918, 1920
6 (2)
1931–1960 1941, 1951
2 (0.7)
1961–1990 1965, 1966, 1968, 1972, 1979, 1982, 1986, 1987 8 (2.7)
1991–2015 2002, 2004, 2009, 2014, 2015
5 (1.9)
120
M. Mujumdar et al.
comprises of 5 meteorological sub-divisions over the
southern peninsular India, namely, coastal Andhra
Pradesh, Rayalaseema, South interior Karnataka,
Kerala and Tamil Nadu.
For both SW and NE monsoons, the time series of SPEI
shows considerable interannual and multidecadal variations
with a slight negative trend (Fig. 6.1a, b), corresponding to
the respective monsoon rainfall variations. The declining
trend in SPEI time series is indicative of an increase in the
intensity of droughts. The annual scale SPEI time series is
shown in Fig. 6.1c. The variability in the frequency of SW
monsoon droughts during different epochs can be noted in
Table 6.2. The drought frequency for the period 1901–2016
revealed 21, 19 and 18 cases of moderate to extreme
droughts (SPEI −1) for the SW, NE monsoons and
annual timescale, respectively, with almost 2 droughts per
decade on an average. The number of wet monsoon years
(SPEI 1) is found to be 16, 14 and 19 for the SW, NE
Table 6.1 Various
meteorological drought indices
Index
Computation
Strength and weakness
Percent of normal
precipitation (PNP)
Actual precipitation divided by normal
precipitation—typically a 30 year mean
and multiplied by 100 (%)
Strength: Simple measurement, very
effective in a single region or a single
season, can be calculated for a variety
of timescales
Weakness: Biased by the aridity of
the region, cannot compare with
different locations, cannot identify the
specific impact of drought
Palmer drought
severity index (PDSI)
Computed from precipitation and
temperature (Palmer 1965; Dai et al.
2004)
Strength: Widely used for drought
characterization
Weakness: Lags the detection of
drought over several months due to its
dependency on soil moisture, which is
simplified to one value in each climate
zone
Standardized
precipitation index
(SPI)
SPI is defined based on the cumulative
probability of a given rainfall event. It is
derived from the transformation of fitted
gamma distribution of historical rainfall
to a standard normal distribution (Mckee
et al. 1993)
Strength: Not biased by aridity, better
than PNP and PDSI. It can be
computed for different timescales.
Considers multi-scalar nature of
droughts. Allows comparison of
drought severity at two or more
locations, regardless of climatic
conditions
Weakness: Only precipitation is used
and does not consider other crucial
variables, e.g. temperature
Standardized
precipitation
evapotranspiration
index (SPEI)
SPEI uses accumulations of precipitation
minus potential evapotranspiration
(PET) and thereby accounts for changes
in both supply and demand in moisture
variability over the region of interest
(Vicente-Serrano et al. 2010)
Strength: Similar to SPI. Includes the
effect of temperature via evaporative
demand. More suited to explore
impacts of warming temperatures on
the occurrence of droughts. A more
extensive range of applications than
SPI
Weakness: Sensitive to PET
computation
Several other drought indices have been developed based on different indicator variables such as soil
moisture, run-off and evapotranspiration (Karl and Karl 1983; Mo 2008; Shukla and Wood 2008; Hao and
AghaKouchak 2013)
Table 6.2 List of SW monsoon
droughts from 1901 to 2015.
Years in bold letters represent
severe droughts
Period
Drought years
Total number of droughts (per decade)
1901–1930 1901, 1904, 1905, 1911, 1918, 1920
6 (2)
1931–1960 1941, 1951
2 (0.7)
1961–1990 1965, 1966, 1968, 1972, 1979, 1982, 1986, 1987 8 (2.7)
1991–2015 2002, 2004, 2009, 2014, 2015
5 (1.9)
120
M. Mujumdar et al.